Tag: #StockTrading
-
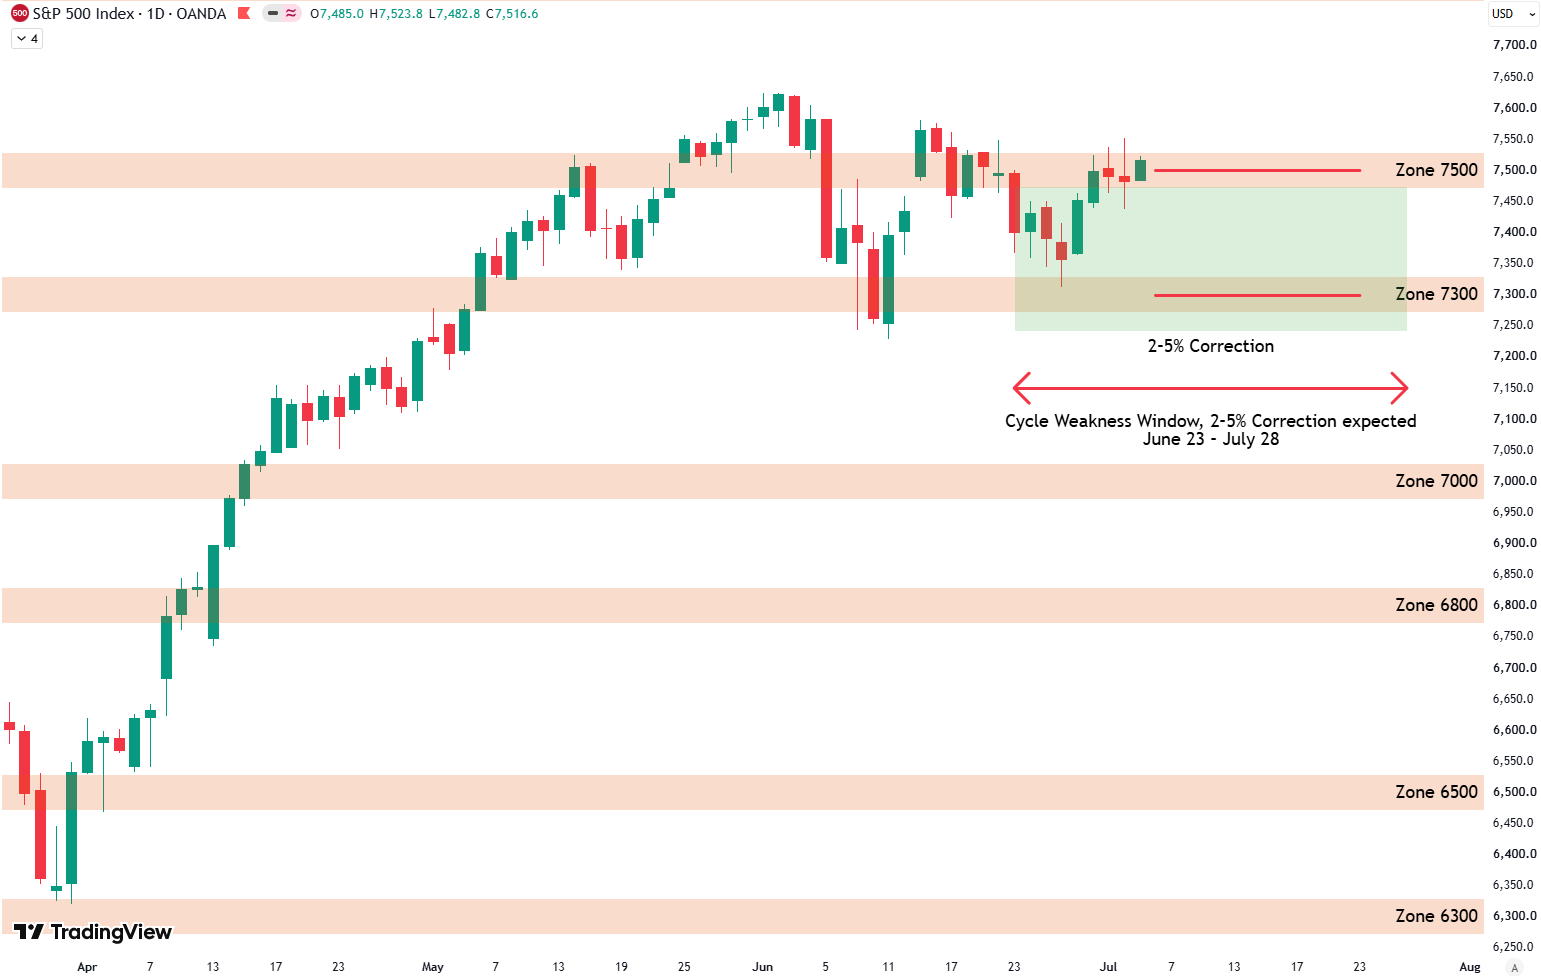
S&P 500 Weekly Analysis: 7300 Holds, 7500 Cap
Week 27, 2026 | +2.2% | -1.4% below all time high Daily TechnicalsLevels marked in red on the chart.The 7500 level becomes the line in the sand. Short Term Risk Bottom: Buy score in green, sell score in red, S&P 500 in black. Top right: Zoomed in version. Top left: Buy and sell signals as…
-
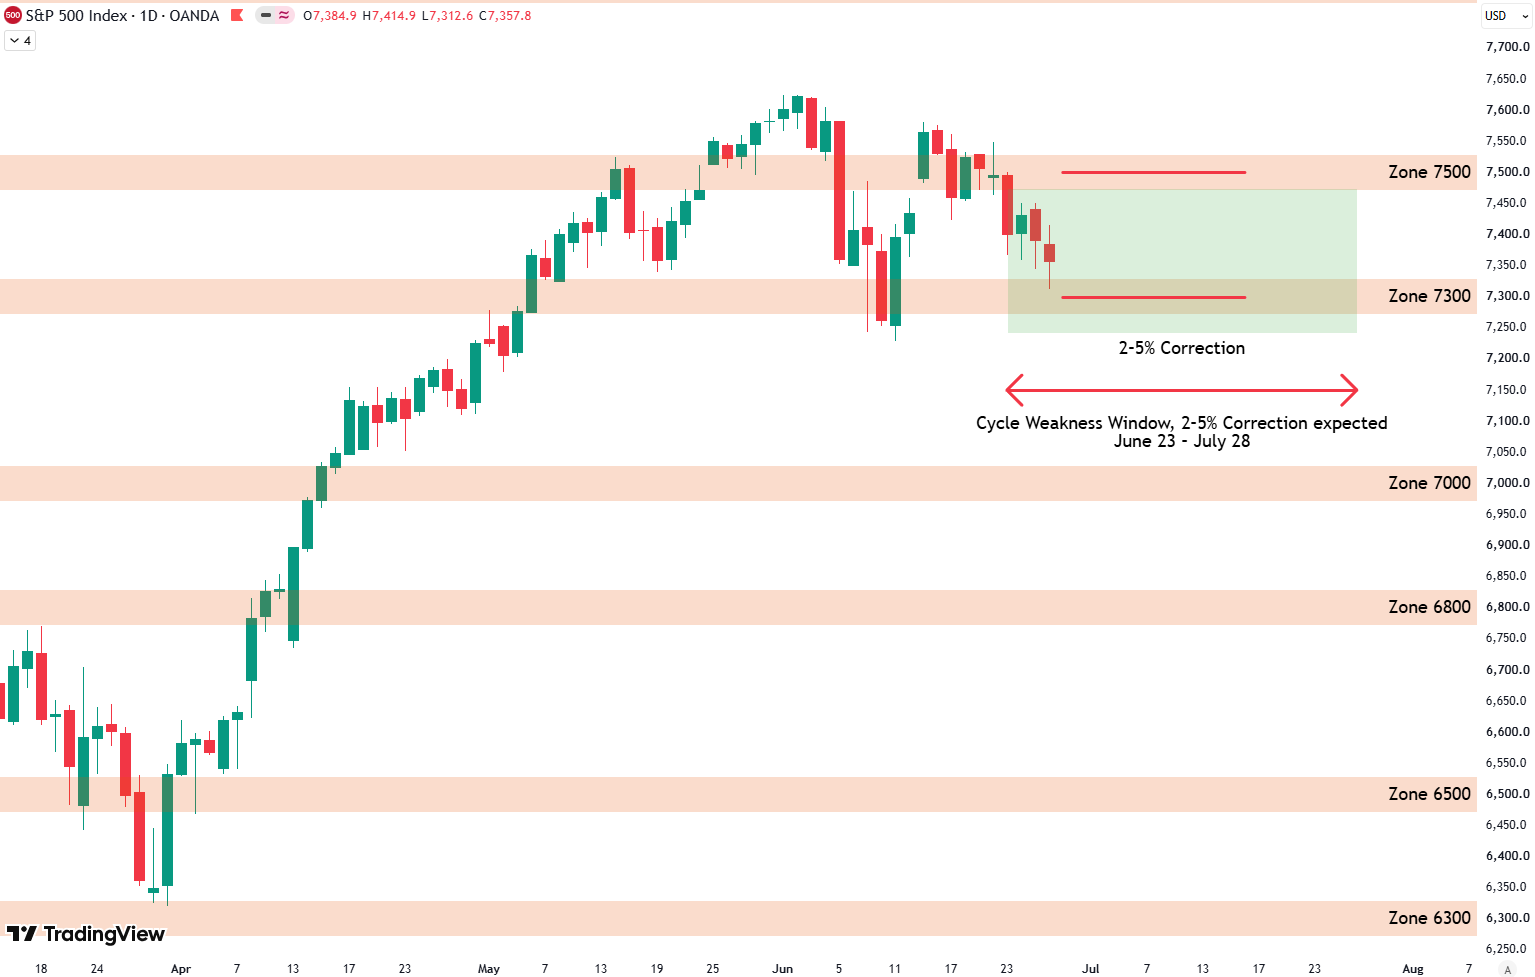
S&P 500 Weekly Analysis: 7300 Retest & July Surge?
Week 26, 2026 | -2% | -3.5% below all time high Daily Technicals (Next Week)Levels marked in red on the chart.The new target to the upside is 7800 points. Short Term Risk (Next 12 Weeks) Bottom: Buy score in green, sell score in red, S&P 500 in black. Top right: Zoomed in version. Top left:…
-
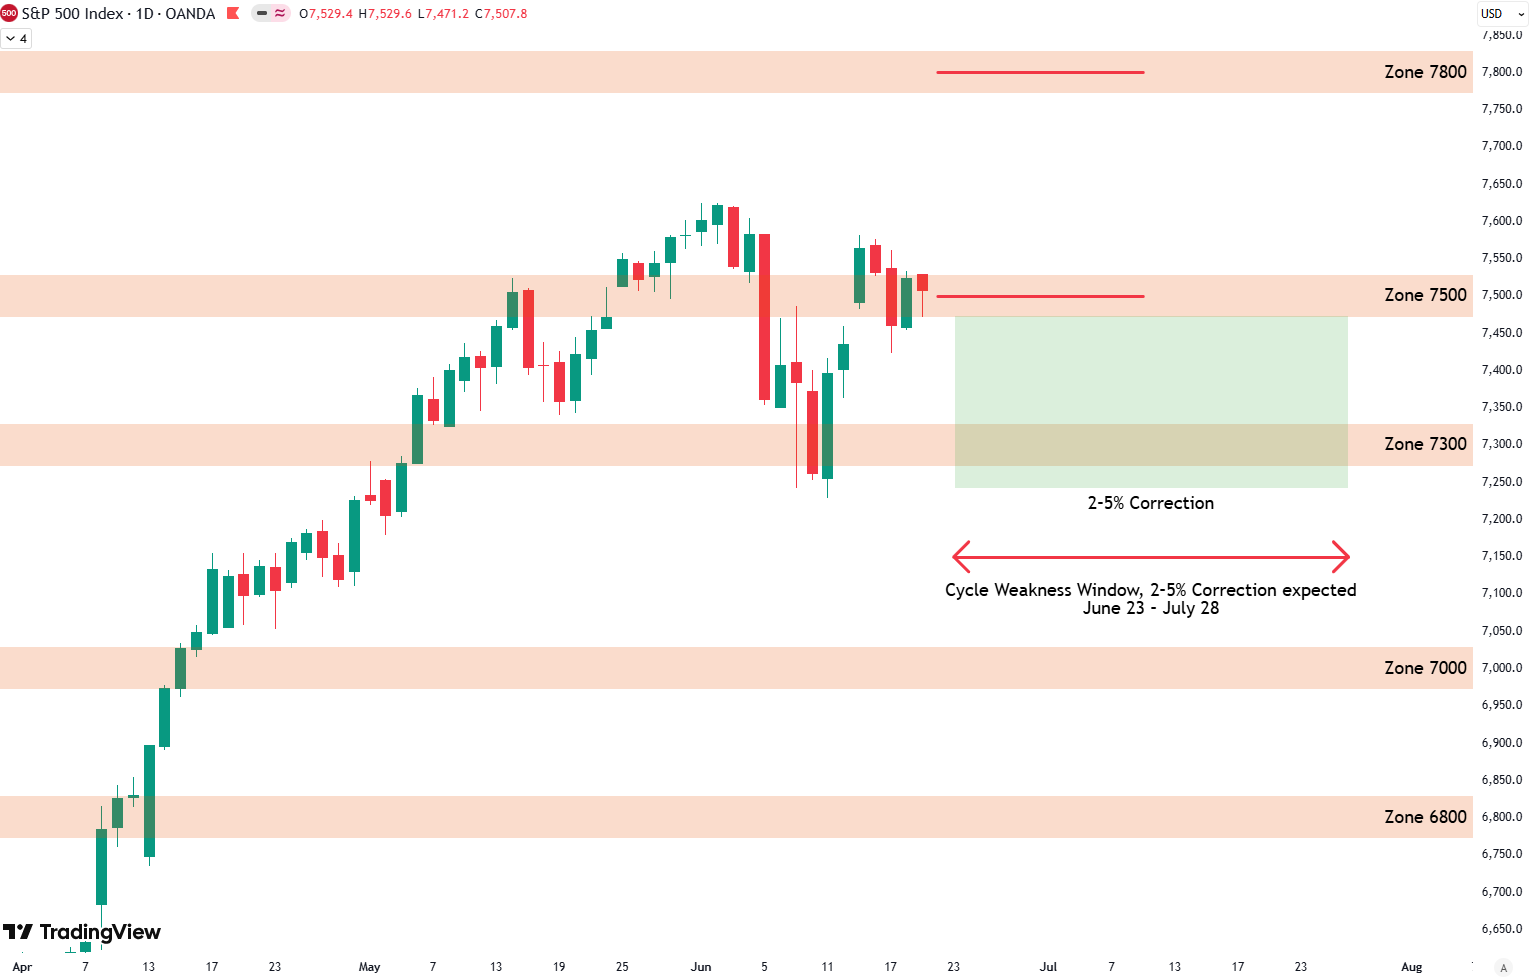
S&P 500 Technical Analysis: New 7800 Price Target
Week 25, 2026 | +1% | -1.5% below all time high Daily Technicals (Next Week)Levels marked in red on the chart.The new target to the upside is 7800 points. Short Term Risk (Next 12 Weeks) Bottom: Buy score in green, sell score in red, S&P 500 in black. Top right: Zoomed in version. Top left:…
-
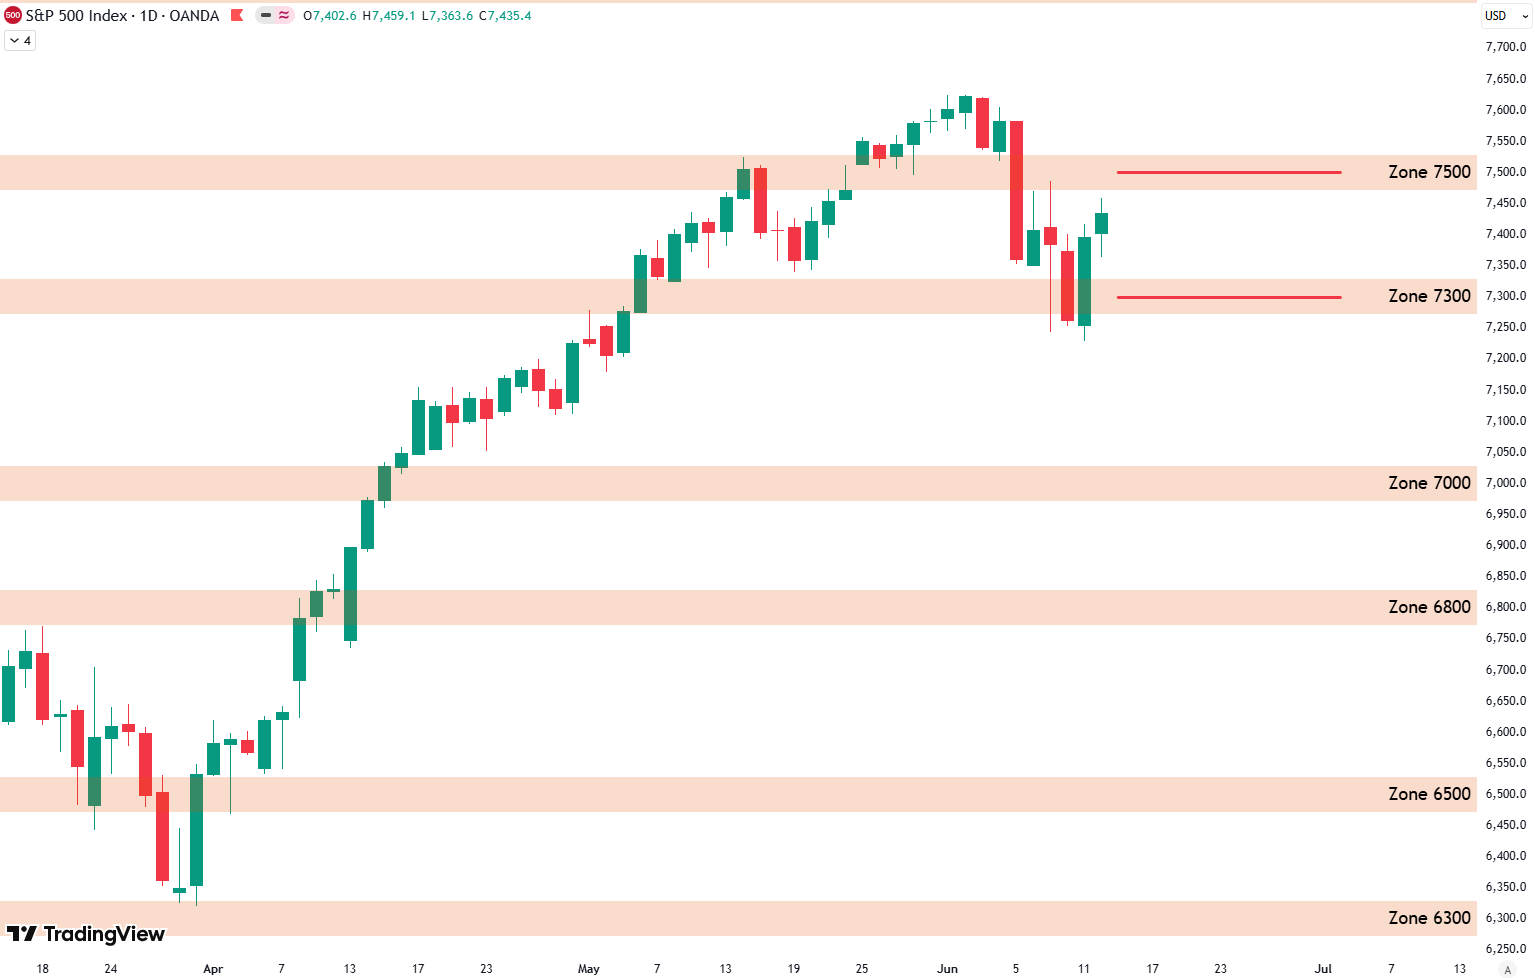
S&P 500 Technical Analysis: 7300 Support Hold?
Week 24, 2026 | +1% | -2.5% below all time high Daily Technicals (Next Week)Levels marked in red on the chart.The 7300 point zone now acts as crucial support where the price recovered nicely. Short Term Risk (Next 12 Weeks) Bottom: Buy score in green, sell score in red, S&P 500 in black. Top right:…
-
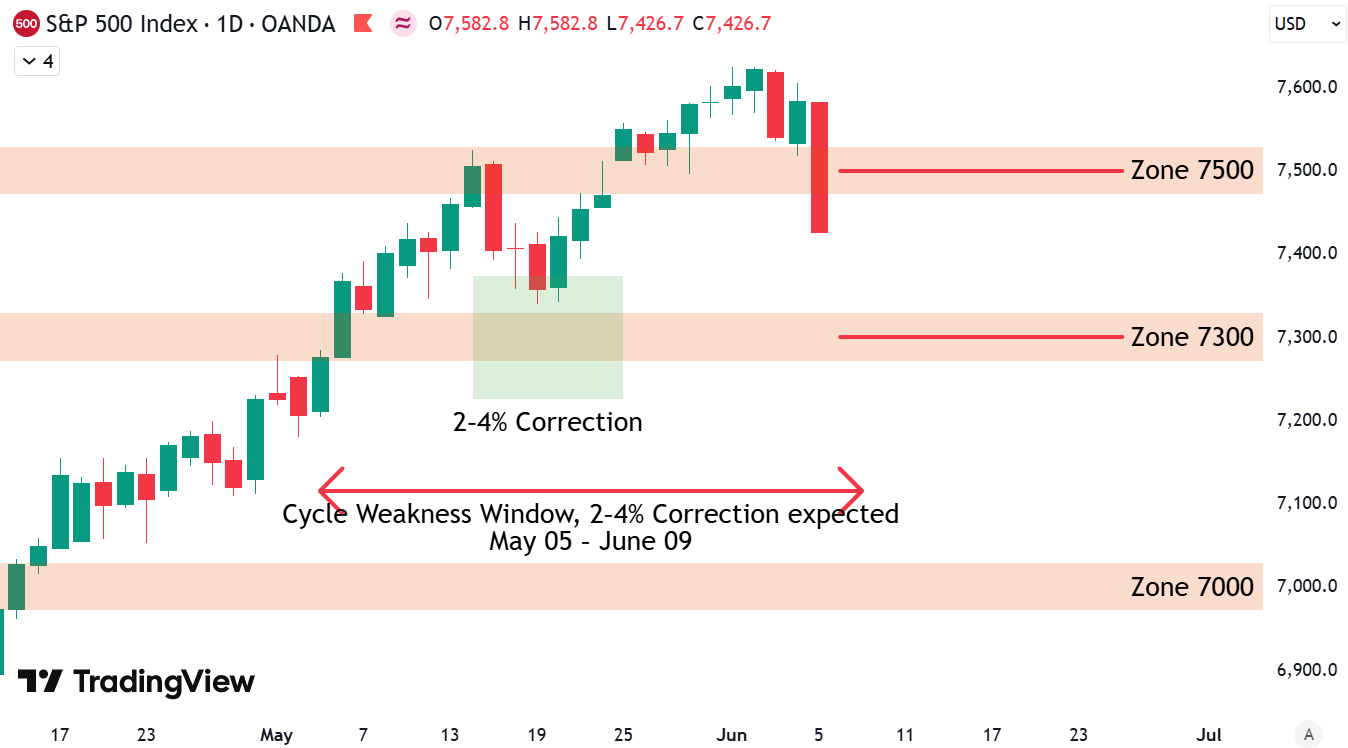
S&P 500 Technical Analysis: Target 7300?
Week 23, 2026 | -1.9% | +17.6% since March low Daily Technicals (Next Week)Levels marked in red on the chart.The 7500 point zone serves as active resistance now. Short Term Risk (Next 12 Weeks) Bottom: Buy score in green, sell score in red, S&P 500 in black. Top right: Zoomed in version. Top left: Buy…
-
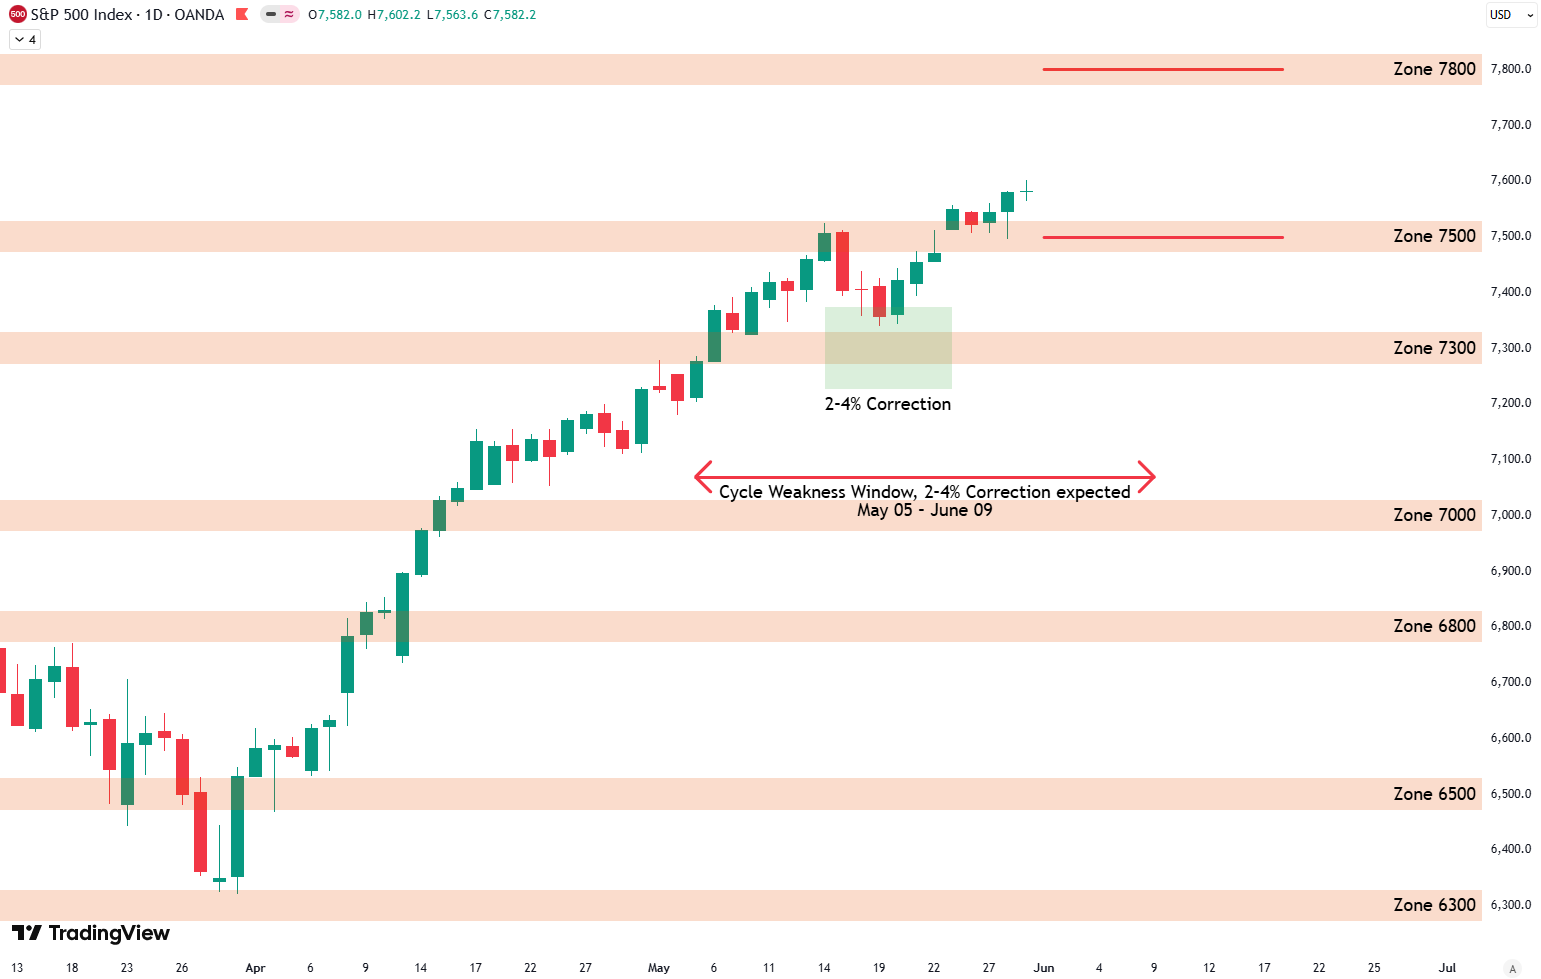
S&P 500 7500 Breakout: Target Set to 7800?
Week 22, 2026 | +1.5% | +20.0% since March low Daily Technicals (Next Week)Levels marked in red on the chart.The 7500 level has transitioned into major support and provides a solid foundation for the next advance toward the 7800 point target. Short Term Risk (Next 12 Weeks) Bottom: Buy score in green, sell score in…
-

Weekly Update S&P 500
Week 21, 2026 | +0.9% | +18.2% since March low Daily Technicals (Next Week)Levels marked in red on the chart.The 7500 point mark must be broken and closed above to officially end this correctional process. Short Term Risk (Next 12 Weeks) Bottom: Buy score in green, sell score in red, S&P 500 in black. Top…
-
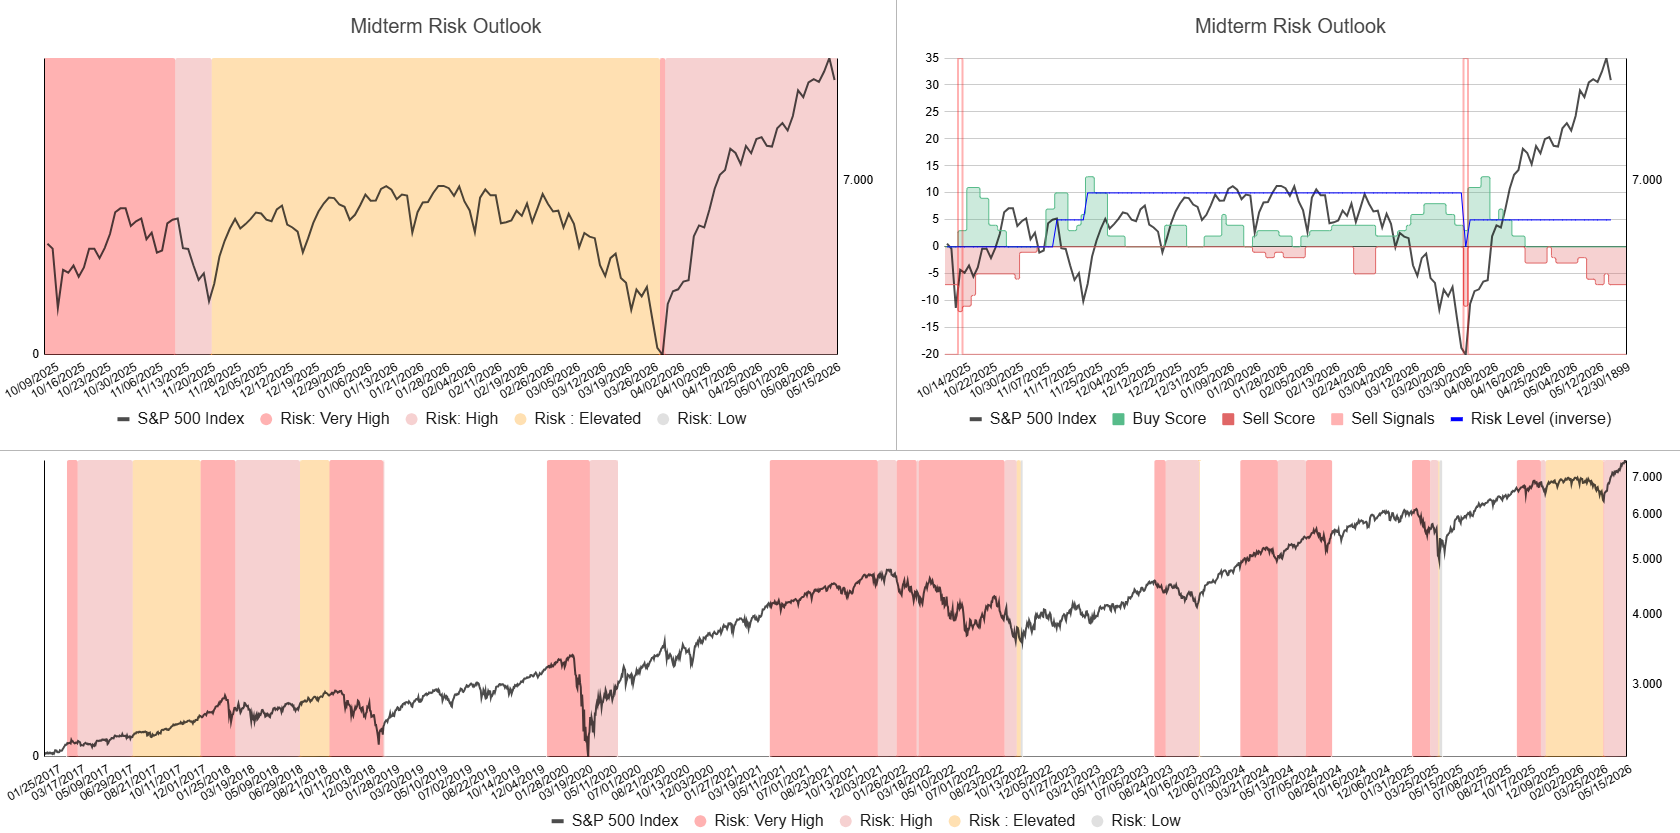
Weekly Update S&P 500
Week 20, 2026 | +0.0% | +17.1% since March low Daily Technicals (Next Week)New levels marked in red on the chart.The 7300 level represents major support and serves as the primary target to the downside. Short Term Risk (Next 12 Weeks) Bottom: Buy score in green, sell score in red, S&P 500 in black. Top…
-
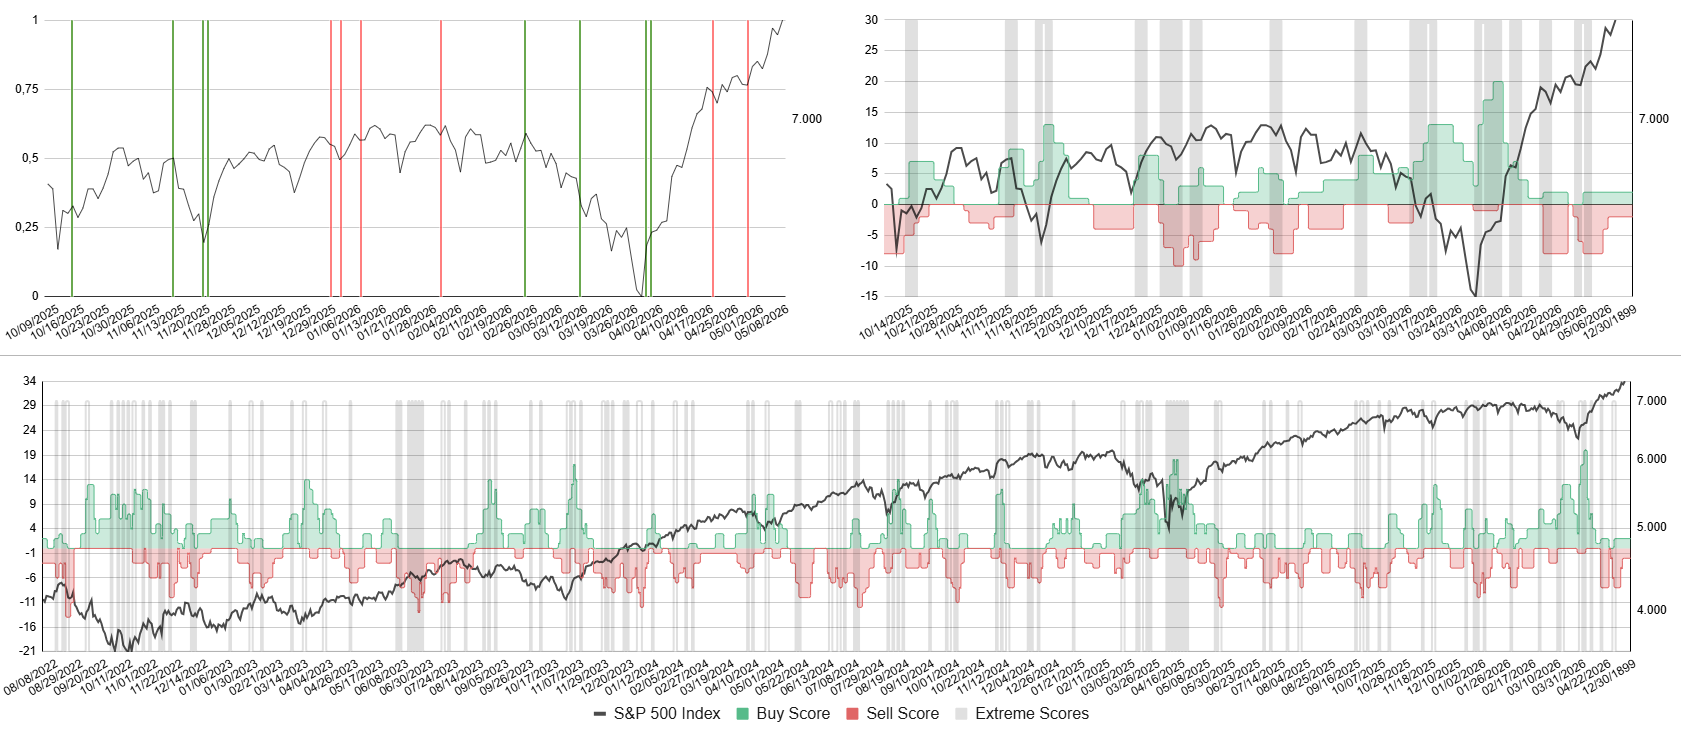
Weekly Update S&P 500
Week 19, 2026 | +2.4% | +17.1% since March low Daily Technicals (Next Week)New levels marked in red on the chart.The 7300 point level has now established itself as support. Short Term Risk (Next 12 Weeks) Bottom: Buy score in green, sell score in red, S&P 500 in black. Top right: Zoomed in version. Top…
-
Weekly Update S&P 500
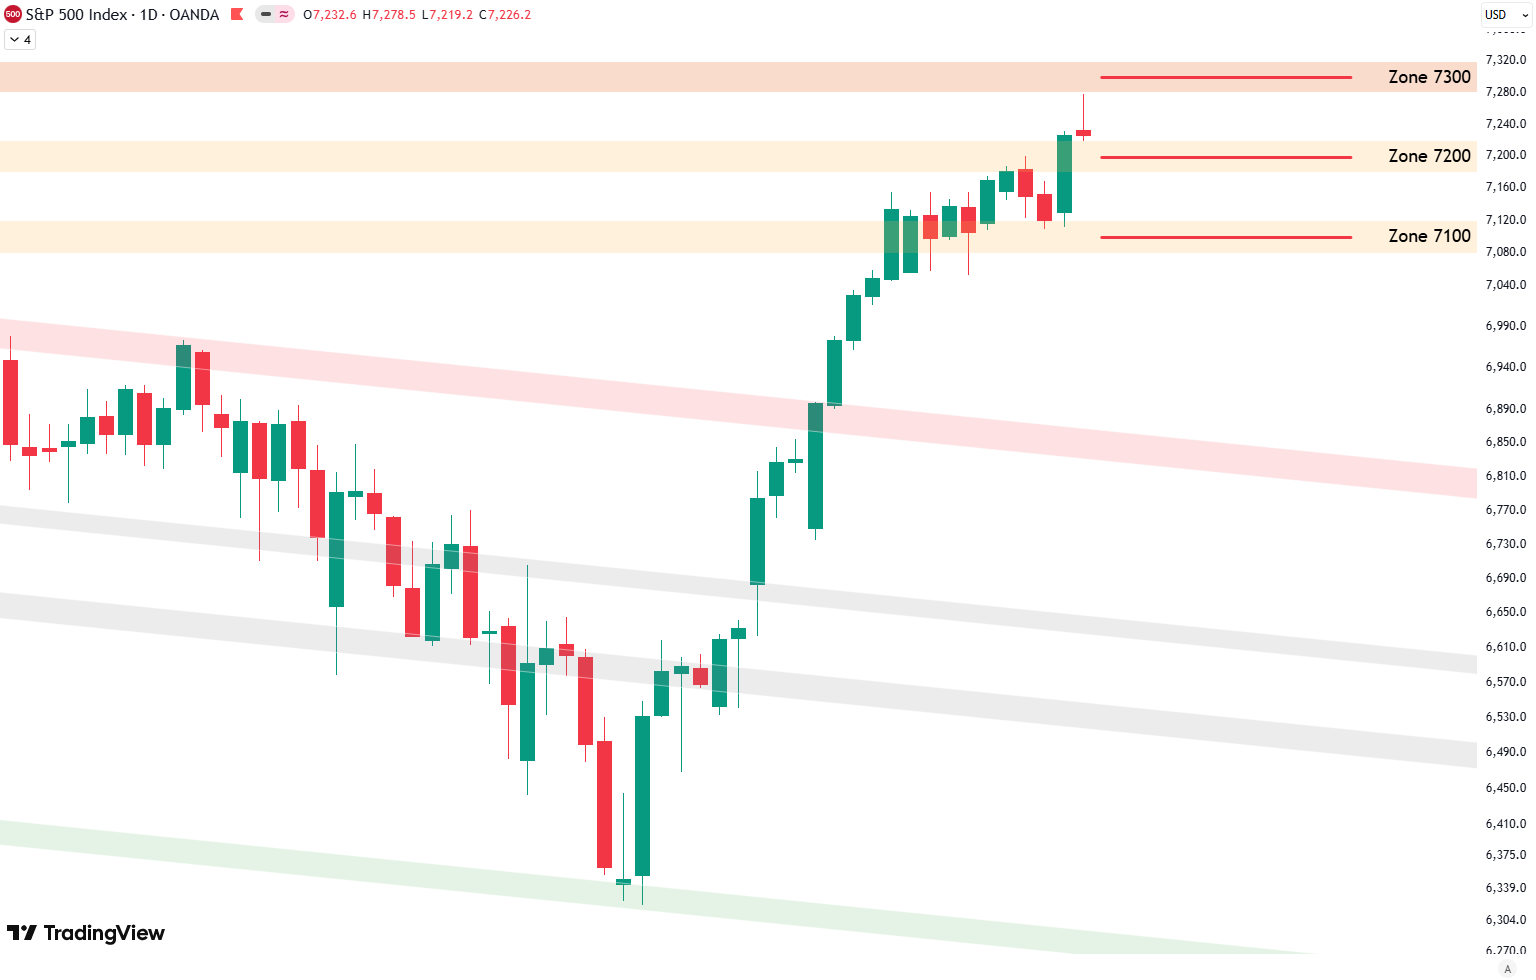
Week 18, 2026 | +0.8% | +14.3% since March low Daily Technicals (Next Week)New levels marked in red on the chart.The 7200 point level has now established itself as support. Short Term Risk (Next 12 Weeks) Bottom: Buy score in green, sell score in red, S&P 500 in black. Top right: Zoomed in version. Top…