
Week 25, 2026 | +1% | -1.5% below all time high
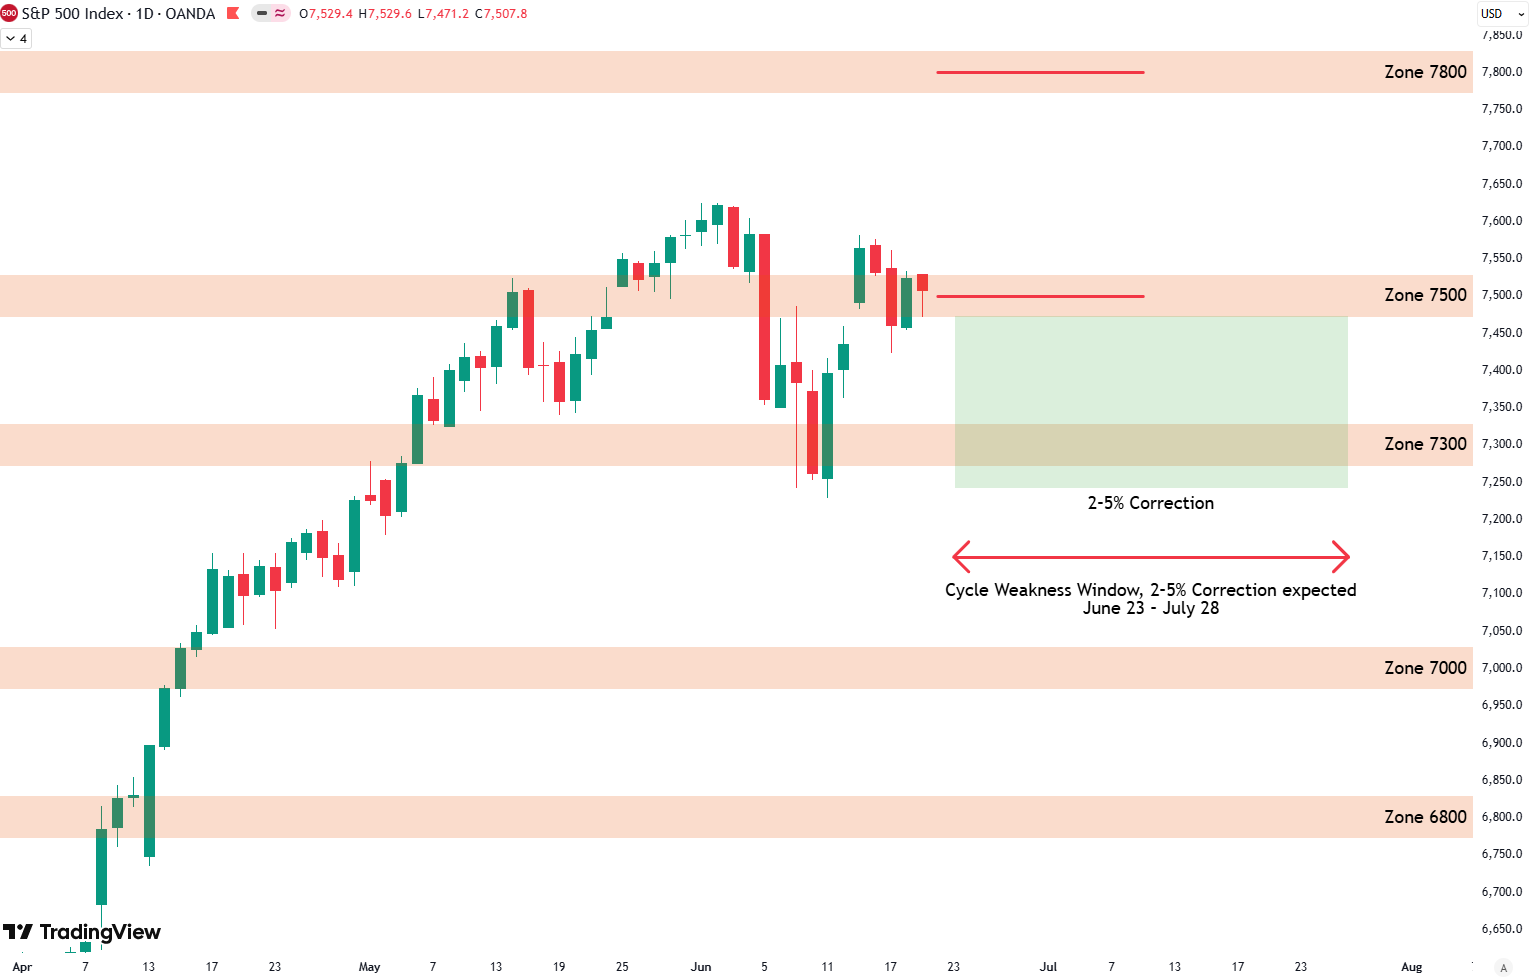
- The S&P 500 broke through 7500 and will establish solid support if it pushes higher next week.
- The corrective phase since early June eased overbought conditions and cleared the way for another leg higher.
- The S&P 500 is entering another cycle of weakness from June 23 to July 28 where an expected 2% to 5% correction is shown by the green box on the chart.
Daily Technicals (Next Week)
Levels marked in red on the chart.
The new target to the upside is 7800 points.
- Bullish at 7500.
- Bearish at 7800.
Short Term Risk (Next 12 Weeks)
- No signal this week.
- Buy and sell score decreased and leave room for new signals.

Bottom: Buy score in green, sell score in red, S&P 500 in black.
Top right: Zoomed in version. Top left: Buy and sell signals as vertical lines.
Sign up with your email for free to receive buy and sell signals as soon as they occur:
Mid Term Risk (Next 3-9 Months)
Very Low Risk | Low Risk | Elevated Risk | High Risk | Very High Risk
- No change.
- The mid term risk indicator shifted from very high to high risk in mid June 2026.
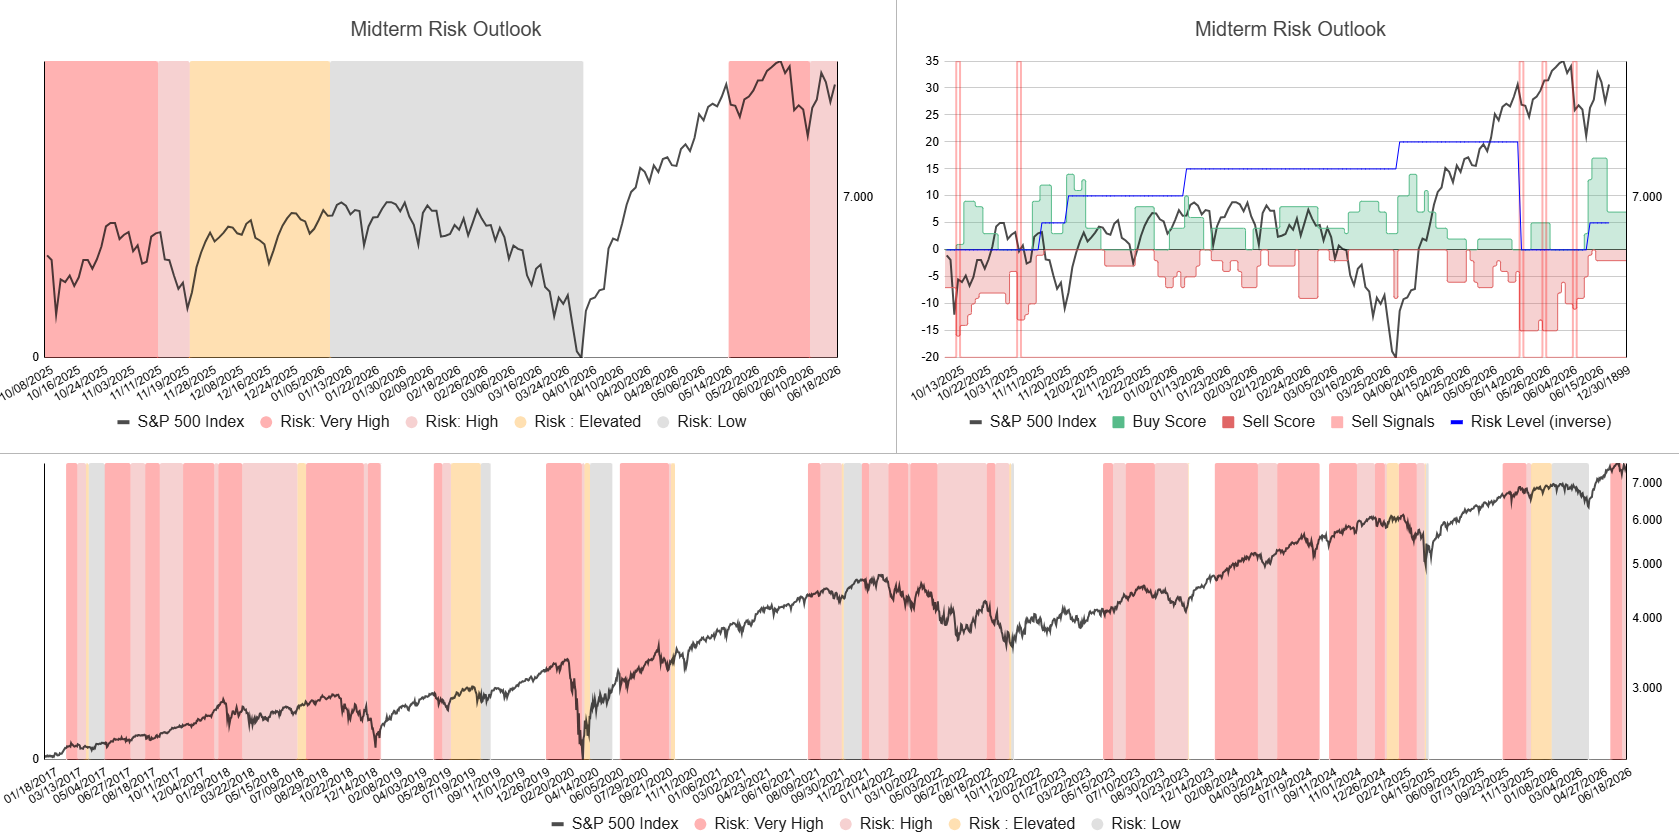
Top: Indicator with internal signals determining risk levels.
Bottom: S&P 500 in black with risk regimes ranging from very low to very high (white, grey, orange and red shaded areas).
Long Term Risk (Next 9-18 Months)
Very Low Risk | Low Risk | High Risk | Very High Risk
- No change.
- The long term risk indicator shifted from very high to high risk at the end of April 2026.

Seasonality
- Weak May and June
- Seasonality suggests a strong Q2 start, followed by weakness in May and June.

Dashboard
All information summarized in our dashboard:

Stay ahead of the market! Sign up for our weekly updates and get additional expert insights on the S&P 500, key support levels, and market trends.
Leave a Reply