Tag: #Stocks
-
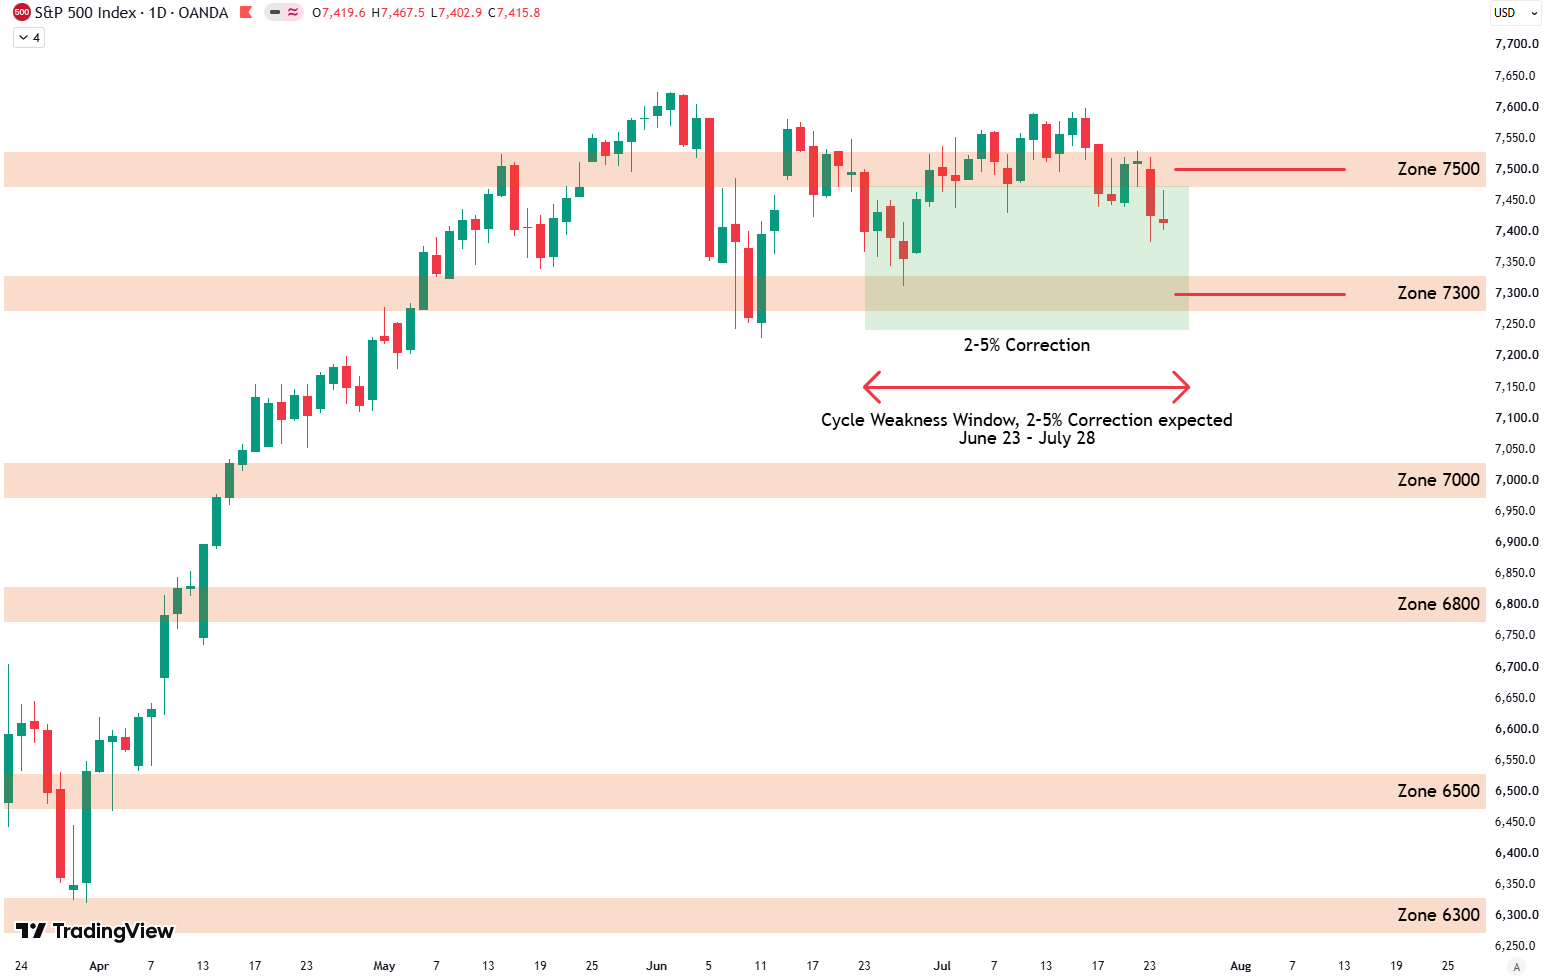
S&P 500 Weekly Analysis: Still below 7500 Line in the Sand
Week 30, 2026 | -0.6% | -2.7% below all time high Daily TechnicalsLevels marked in red on the chart.The S&P 500 has now basically gone nowhere in ten weeks. Short Term Risk Bottom: Buy score in green, sell score in red, S&P 500 in black. Top right: Zoomed in version. Top left: Buy and sell…
-

ETF Technical Analysis Strategy: When to Buy & Trim
Welcome to our ETF update. We provide an overview of different ETFs across various asset classes and base our analysis on technicals. We list some ETFs that, from a risk/reward perspective, currently look like good buy opportunities, and others that are better suited as sell or take-profit options right now. Want to know the best…
-
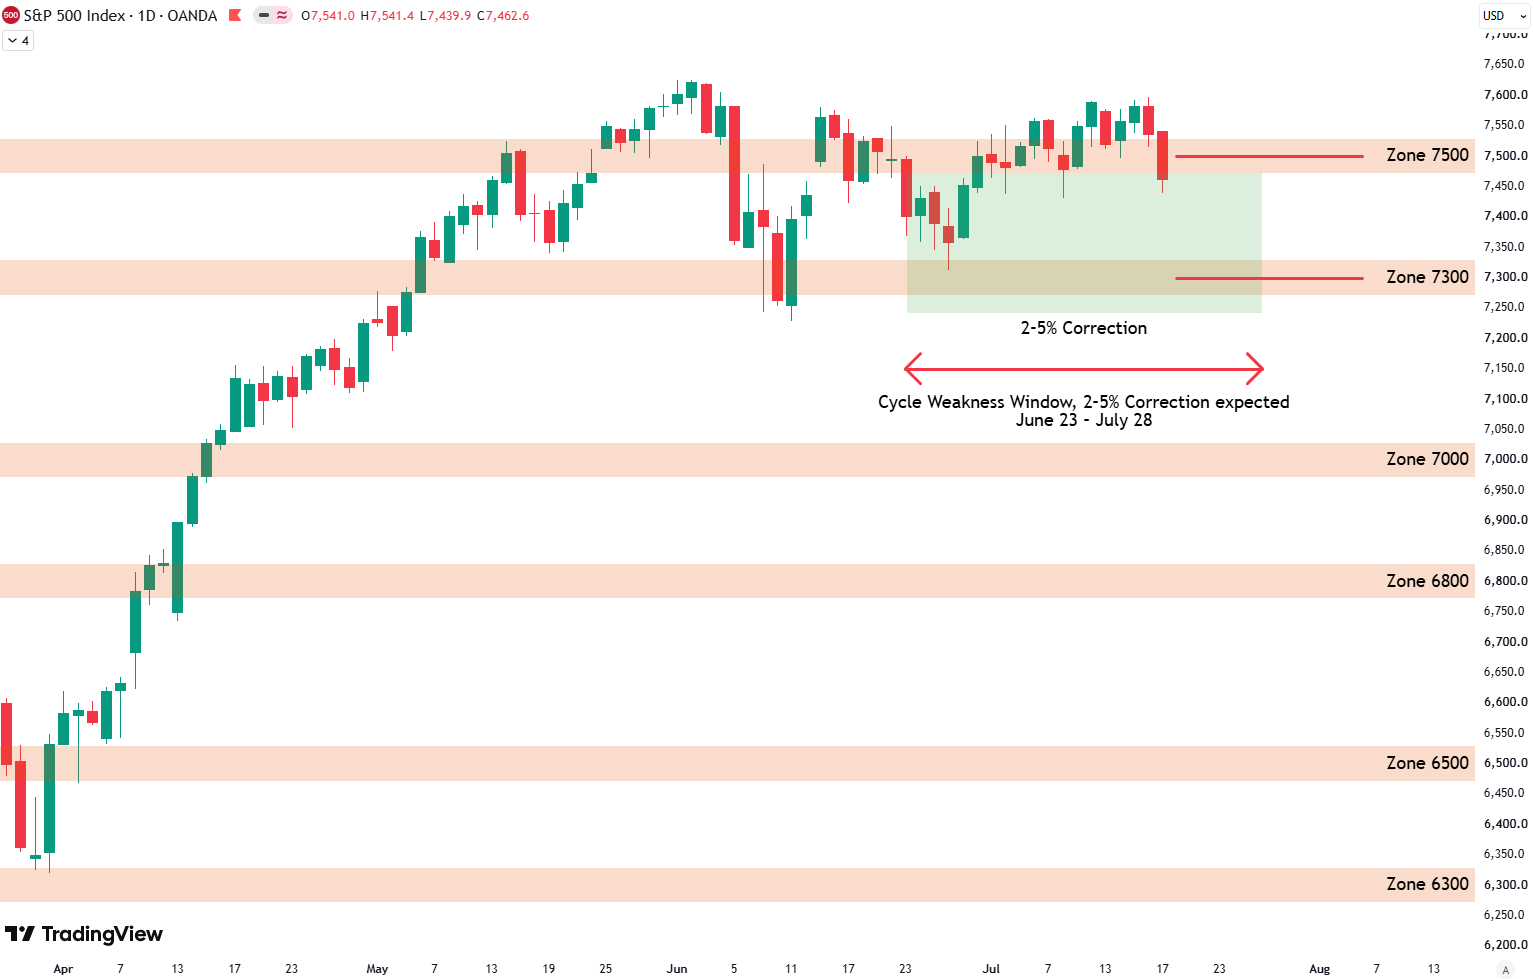
S&P 500 Weekly Analysis: Below 7500 Line in the Sand
Week 29, 2026 | -1.7% | -2.1% below all time high Daily TechnicalsLevels marked in red on the chart.The S&P 500 has now basically gone nowhere in two months. Short Term Risk Bottom: Buy score in green, sell score in red, S&P 500 in black. Top right: Zoomed in version. Top left: Buy and sell…
-
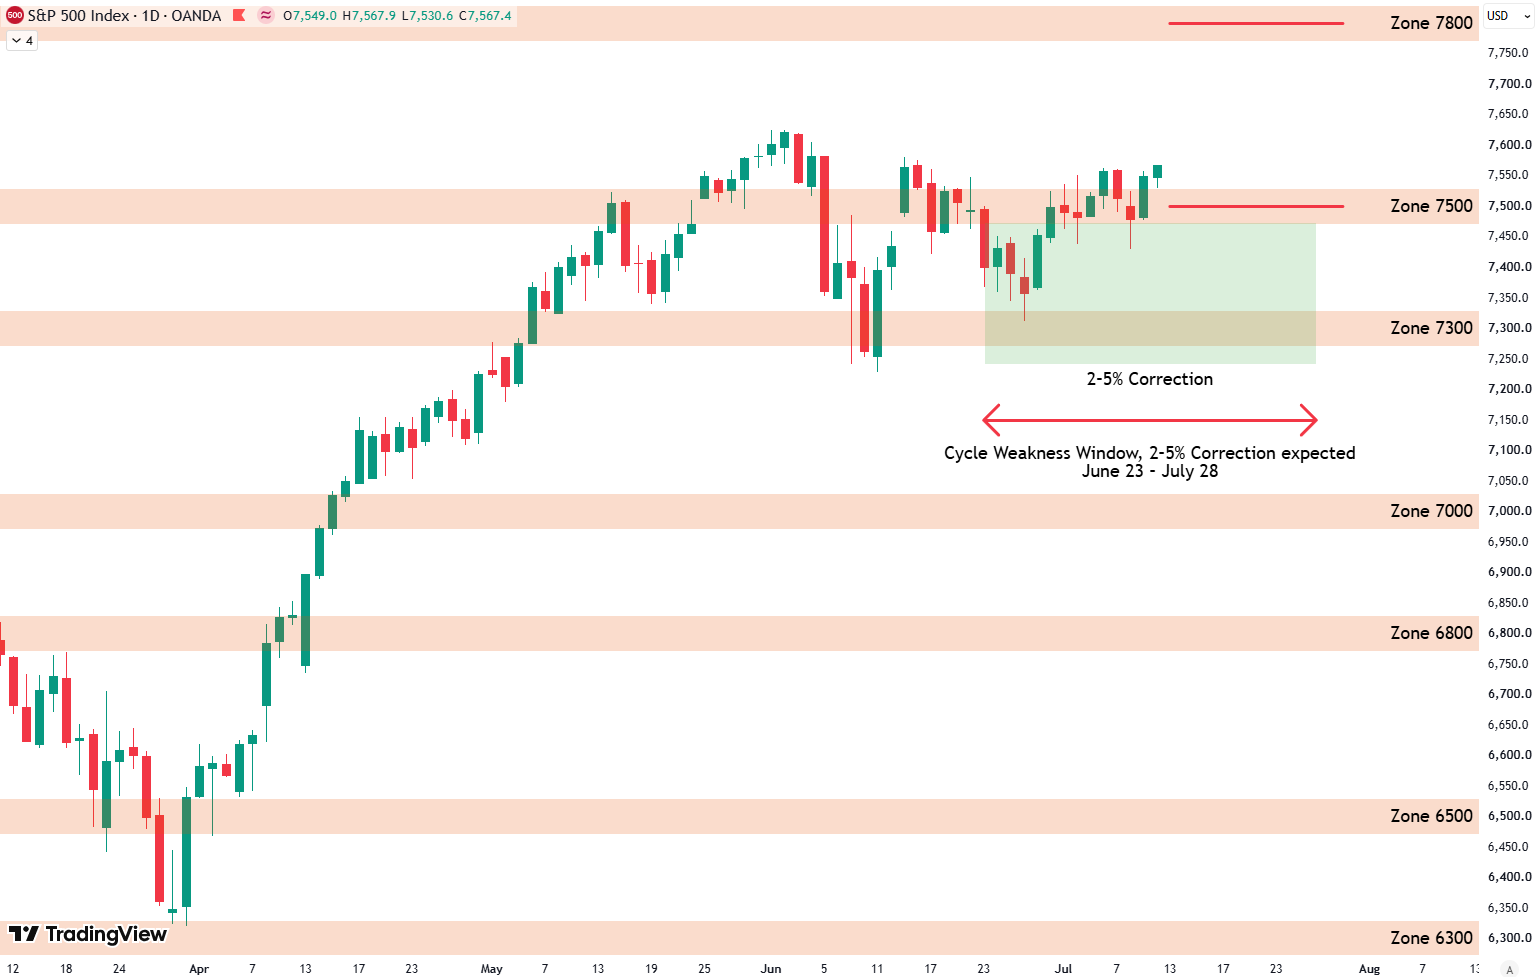
S&P 500 Weekly Analysis: 7500 Breakout & Target 7800
Week 28, 2026 | +0.7% | -0.8% below all time high Daily TechnicalsLevels marked in red on the chart.The 7800 level now becomes the primary target to the upside. Short Term Risk Bottom: Buy score in green, sell score in red, S&P 500 in black. Top right: Zoomed in version. Top left: Buy and sell…
-
ETF Technical Analysis Strategy: When to Buy & Trim
Welcome to our ETF update. We provide an overview of different ETFs across various asset classes and base our analysis on technicals. We list some ETFs that, from a risk/reward perspective, currently look like good buy opportunities, and others that are better suited as sell or take-profit options right now. Want to know the best…
-
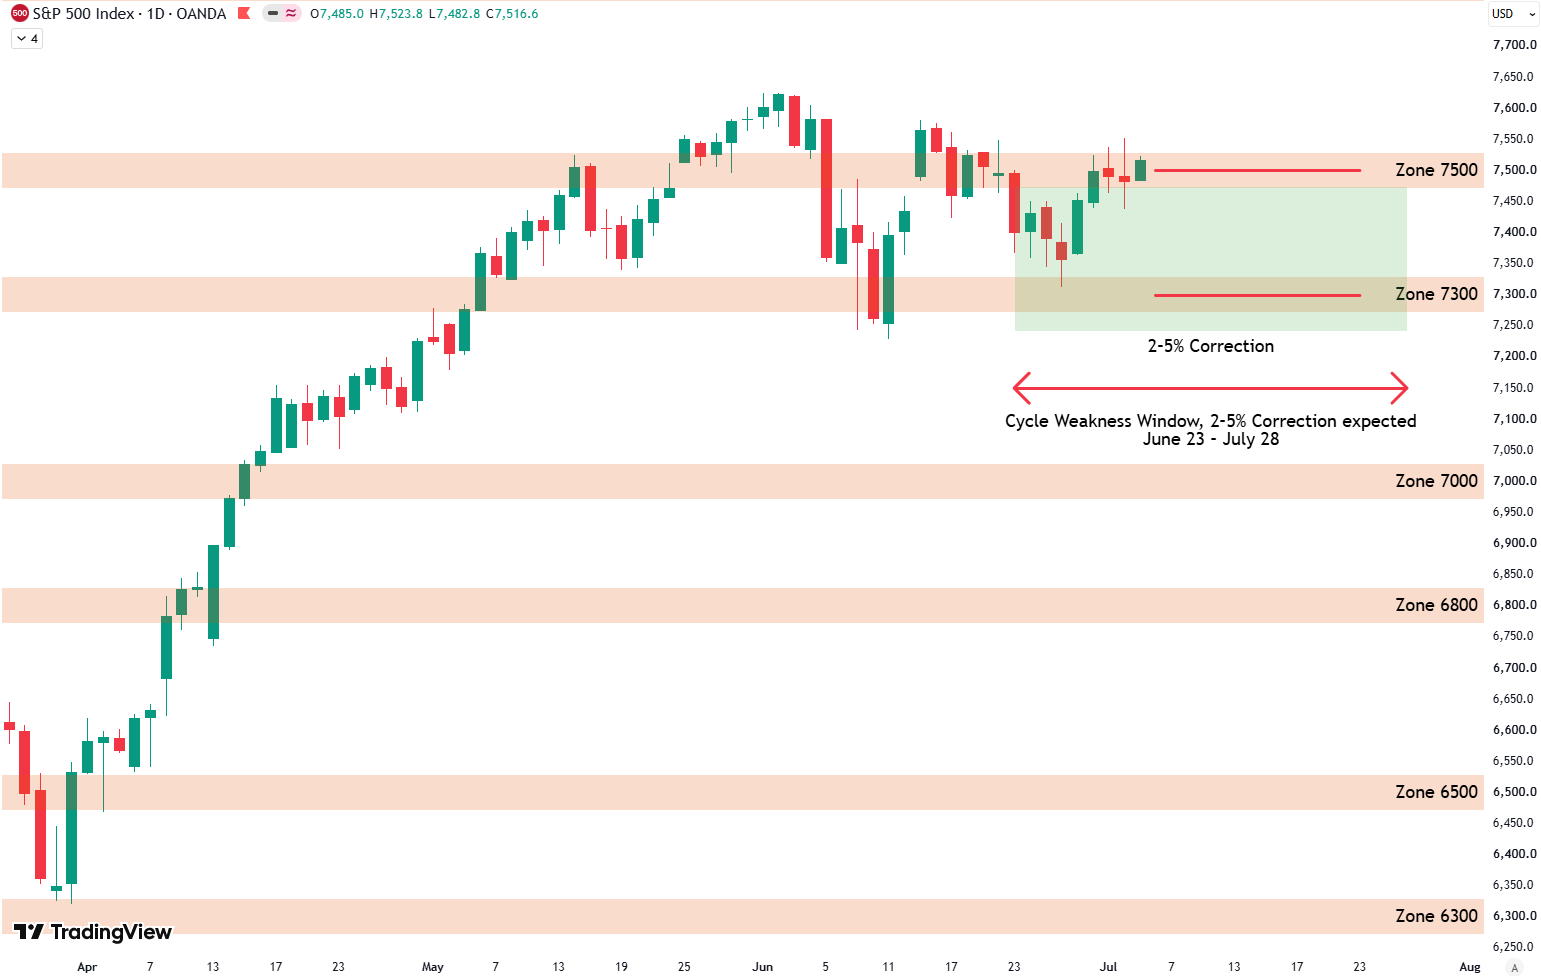
S&P 500 Weekly Analysis: 7300 Holds, 7500 Cap
Week 27, 2026 | +2.2% | -1.4% below all time high Daily TechnicalsLevels marked in red on the chart.The 7500 level becomes the line in the sand. Short Term Risk Bottom: Buy score in green, sell score in red, S&P 500 in black. Top right: Zoomed in version. Top left: Buy and sell signals as…
-
ETF Technical Analysis Strategy: When to Buy & Trim
Welcome to our ETF update. We provide an overview of different ETFs across various asset classes and base our analysis on technicals. We list some ETFs that, from a risk/reward perspective, currently look like good buy opportunities, and others that are better suited as sell or take-profit options right now. Want to know the best…
-
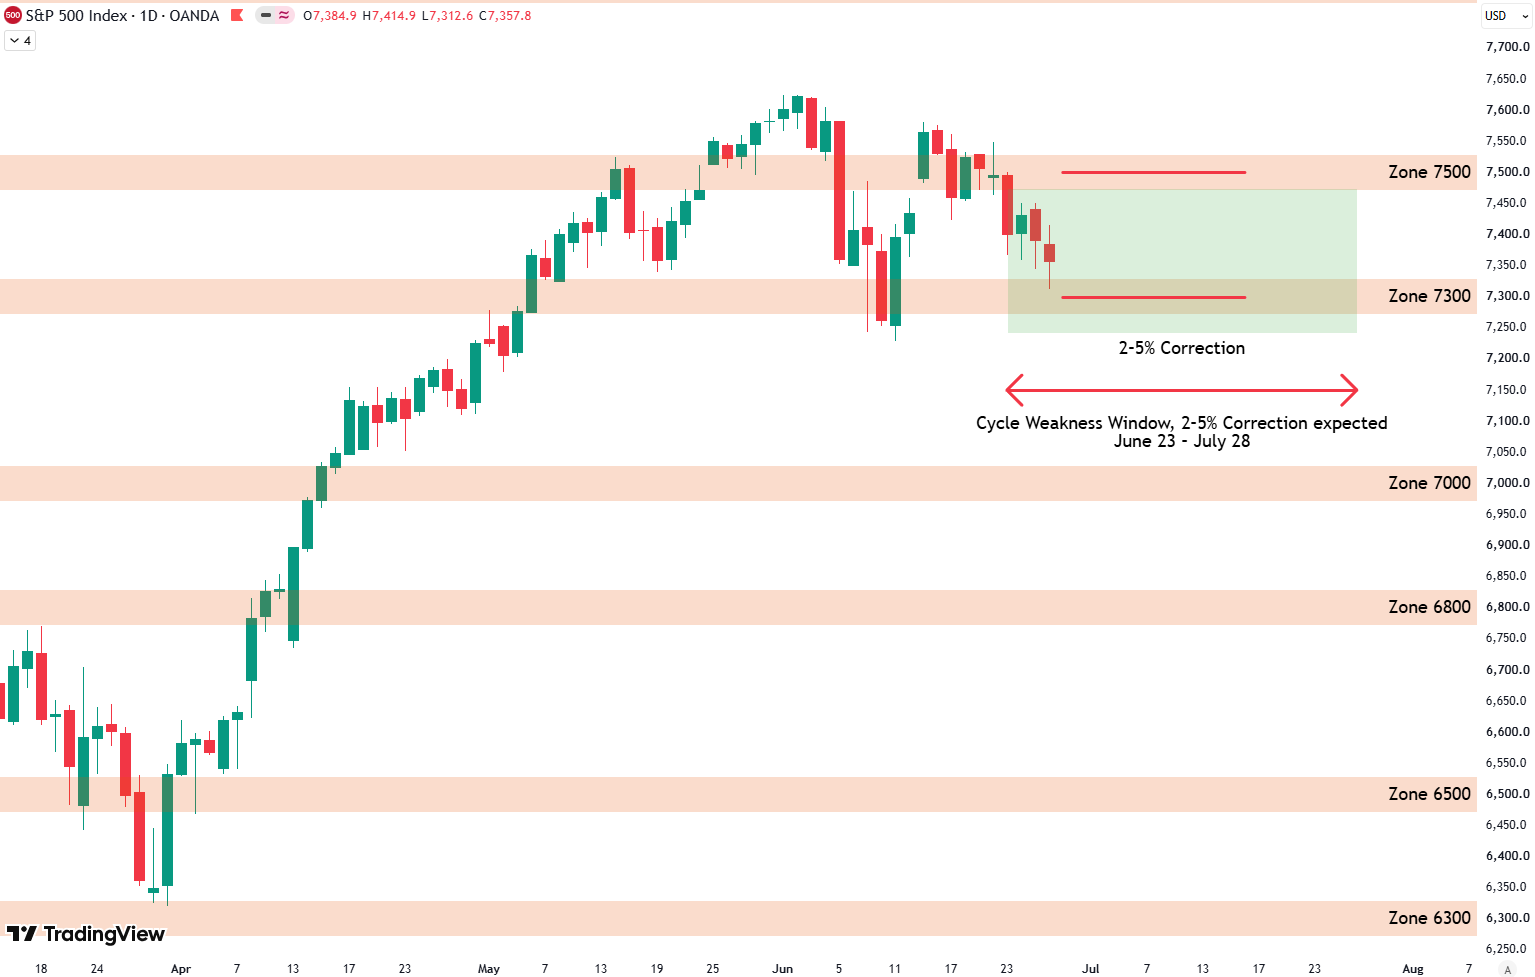
S&P 500 Weekly Analysis: 7300 Retest & July Surge?
Week 26, 2026 | -2% | -3.5% below all time high Daily Technicals (Next Week)Levels marked in red on the chart.The new target to the upside is 7800 points. Short Term Risk (Next 12 Weeks) Bottom: Buy score in green, sell score in red, S&P 500 in black. Top right: Zoomed in version. Top left:…
-
ETF Technical Analysis Strategy: When to Buy & Trim
Welcome to our ETF update. We provide an overview of different ETFs across various asset classes and base our analysis on technicals. We list some ETFs that, from a risk/reward perspective, currently look like good buy opportunities, and others that are better suited as sell or take-profit options right now. Want to know the best…
-
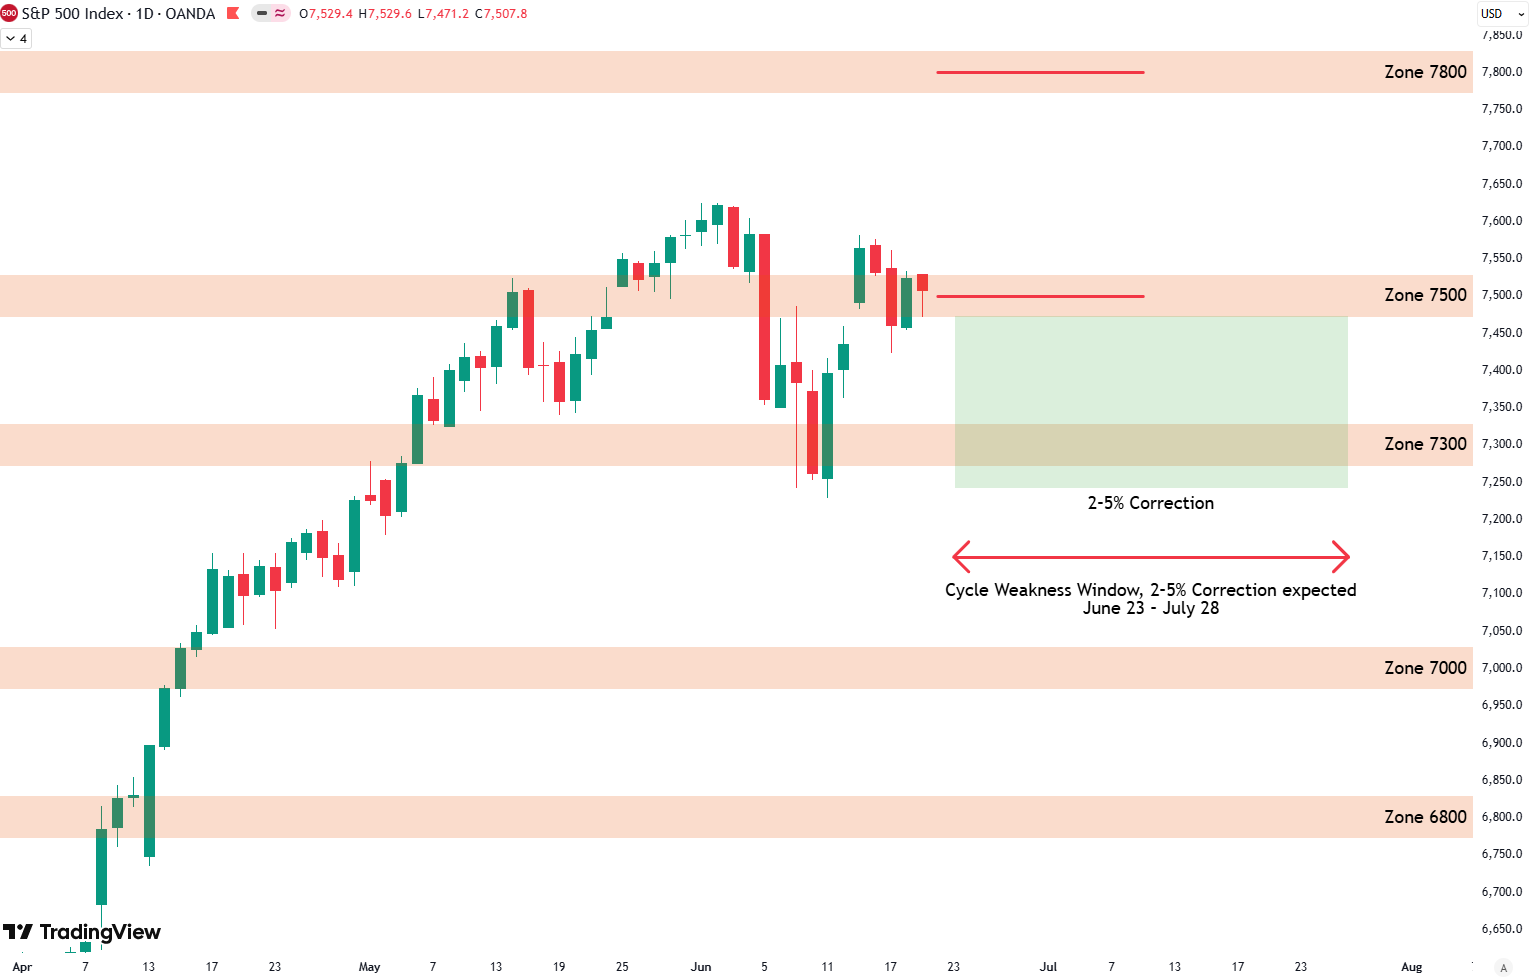
S&P 500 Technical Analysis: New 7800 Price Target
Week 25, 2026 | +1% | -1.5% below all time high Daily Technicals (Next Week)Levels marked in red on the chart.The new target to the upside is 7800 points. Short Term Risk (Next 12 Weeks) Bottom: Buy score in green, sell score in red, S&P 500 in black. Top right: Zoomed in version. Top left:…