
Week 31, 2026 | 0.9% | -1.8% below all time high
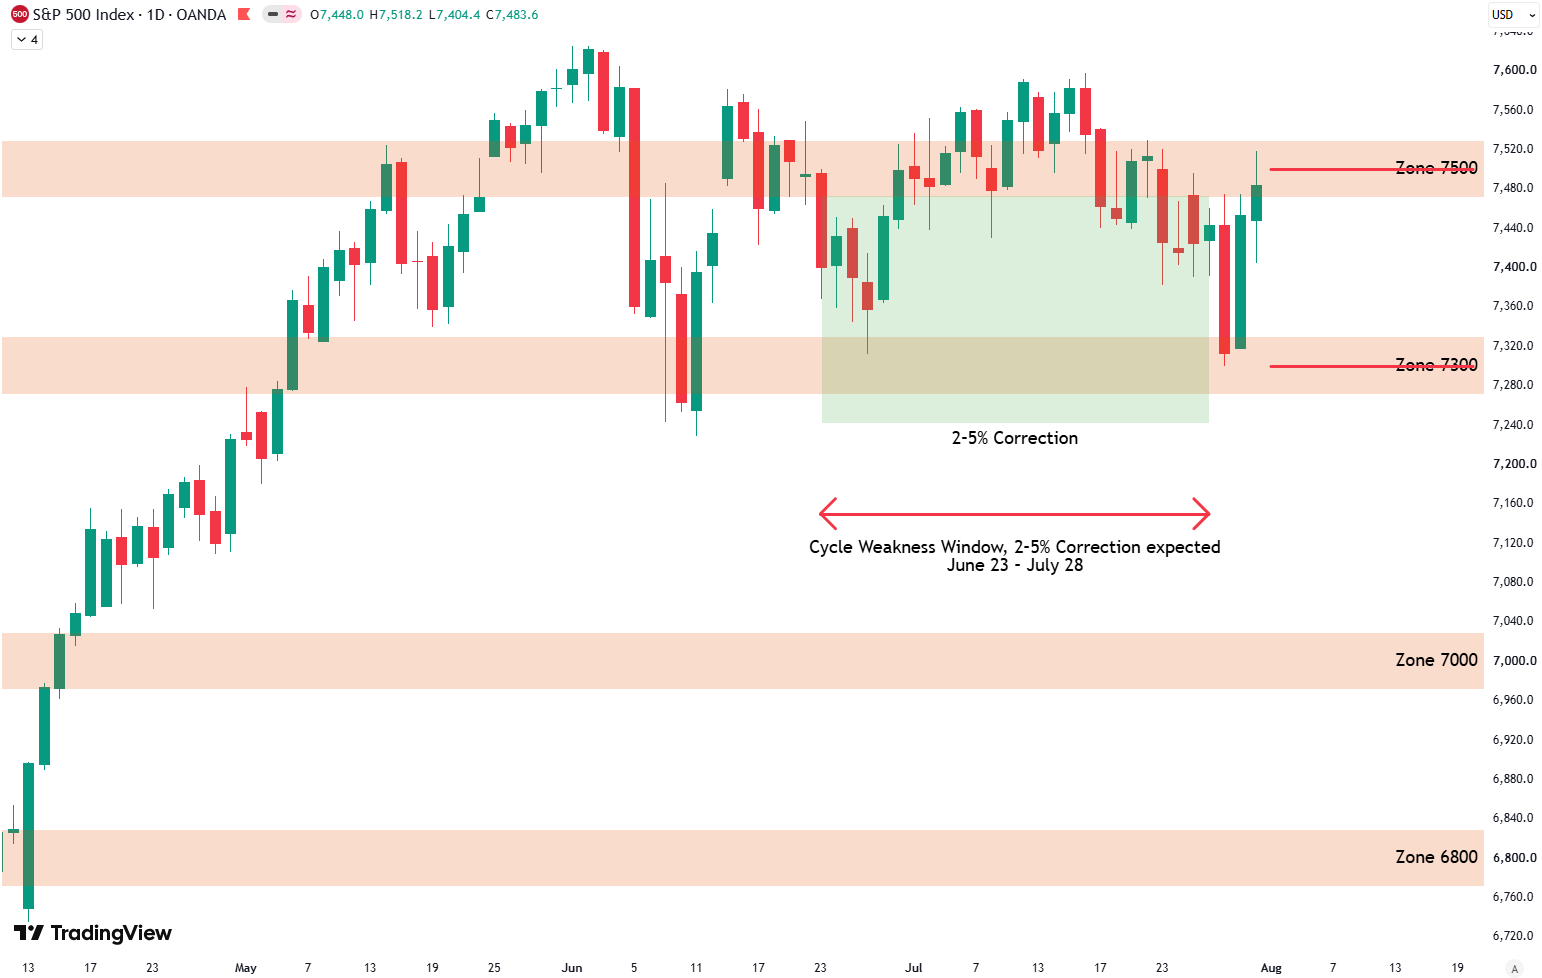
- The S&P 500 experienced a sharp drop this week into the 7300 point zone which held firmly.
- The index bounced strongly out of the 7300 point zone and closed the week at the critical 7500 point zone once again.
- Bullish signals are emerging.
- The 7500 level continues to serve as the structural line in the sand.
- The S&P 500 is now out of its cycle of weakness running from June 23 to July 28.
Daily Technicals
Levels marked in red on the chart.
The S&P 500 has now basically gone nowhere in eleven weeks.
- Bullish at 7300.
- Bearish at 7500.
Short Term Risk
- Buy signal this week.
- The buy score increased this week and triggered a buy signal.
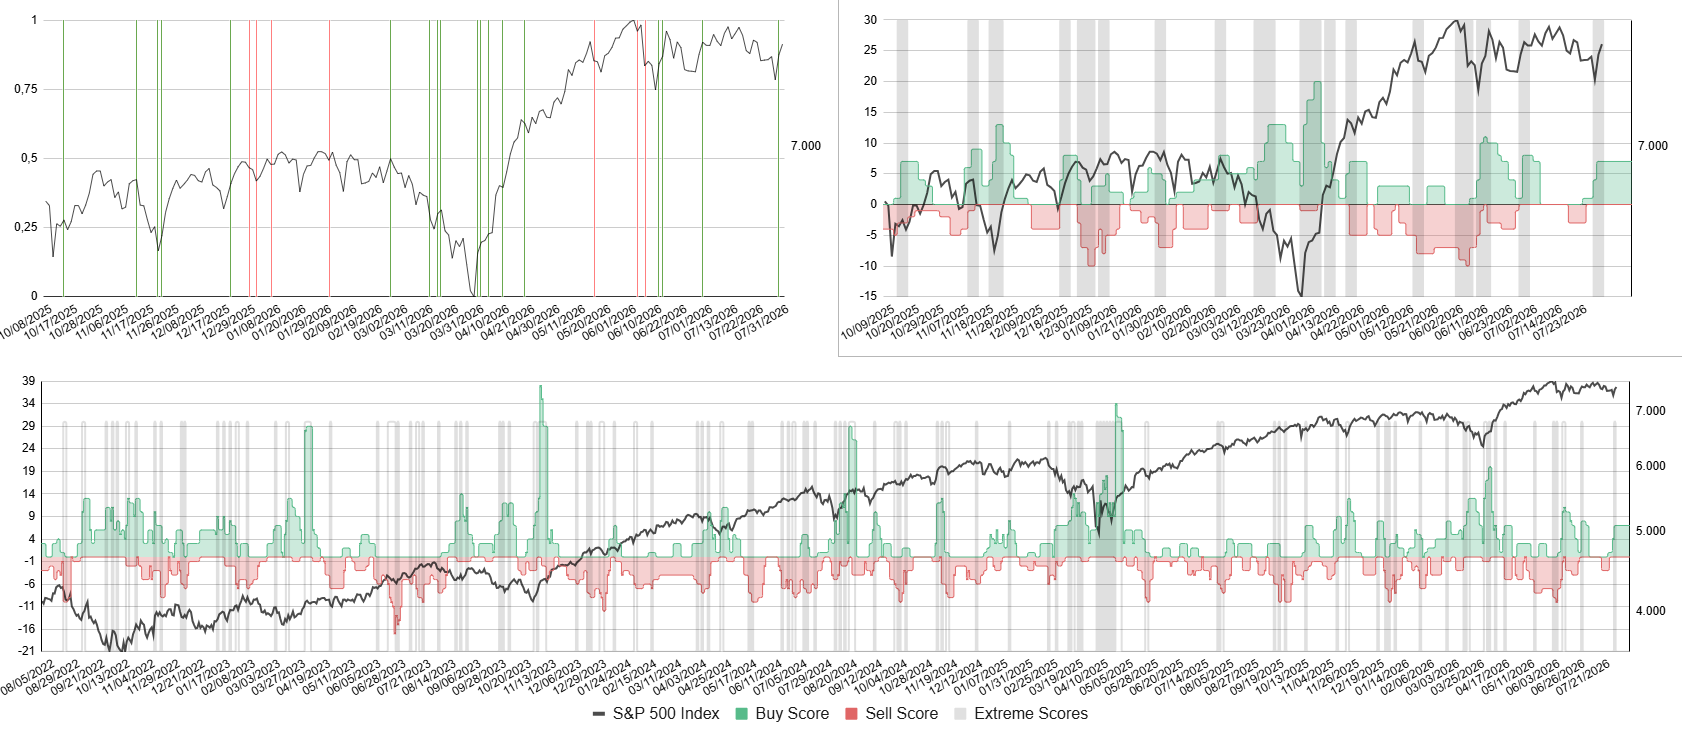
Bottom: Buy score in green, sell score in red, S&P 500 in black.
Top right: Zoomed in version. Top left: Buy and sell signals as vertical lines.
Sign up with your email for free to receive buy and sell signals as soon as they occur:
Long Term Risk
Very Low Risk | Low Risk | Elevated Risk | High Risk | Very High Risk
- Nol change.
- The long term risk indicator shifted to low risk in mid July 2026.

Top: Indicator with internal signals determining risk levels.
Bottom: S&P 500 in black with risk regimes ranging from very low to very high (white, grey, orange and red shaded areas).
Seasonality
- Weak August.
- Seasonality suggests a very strong Q3 start, followed by weakness in August and September.

Dashboard
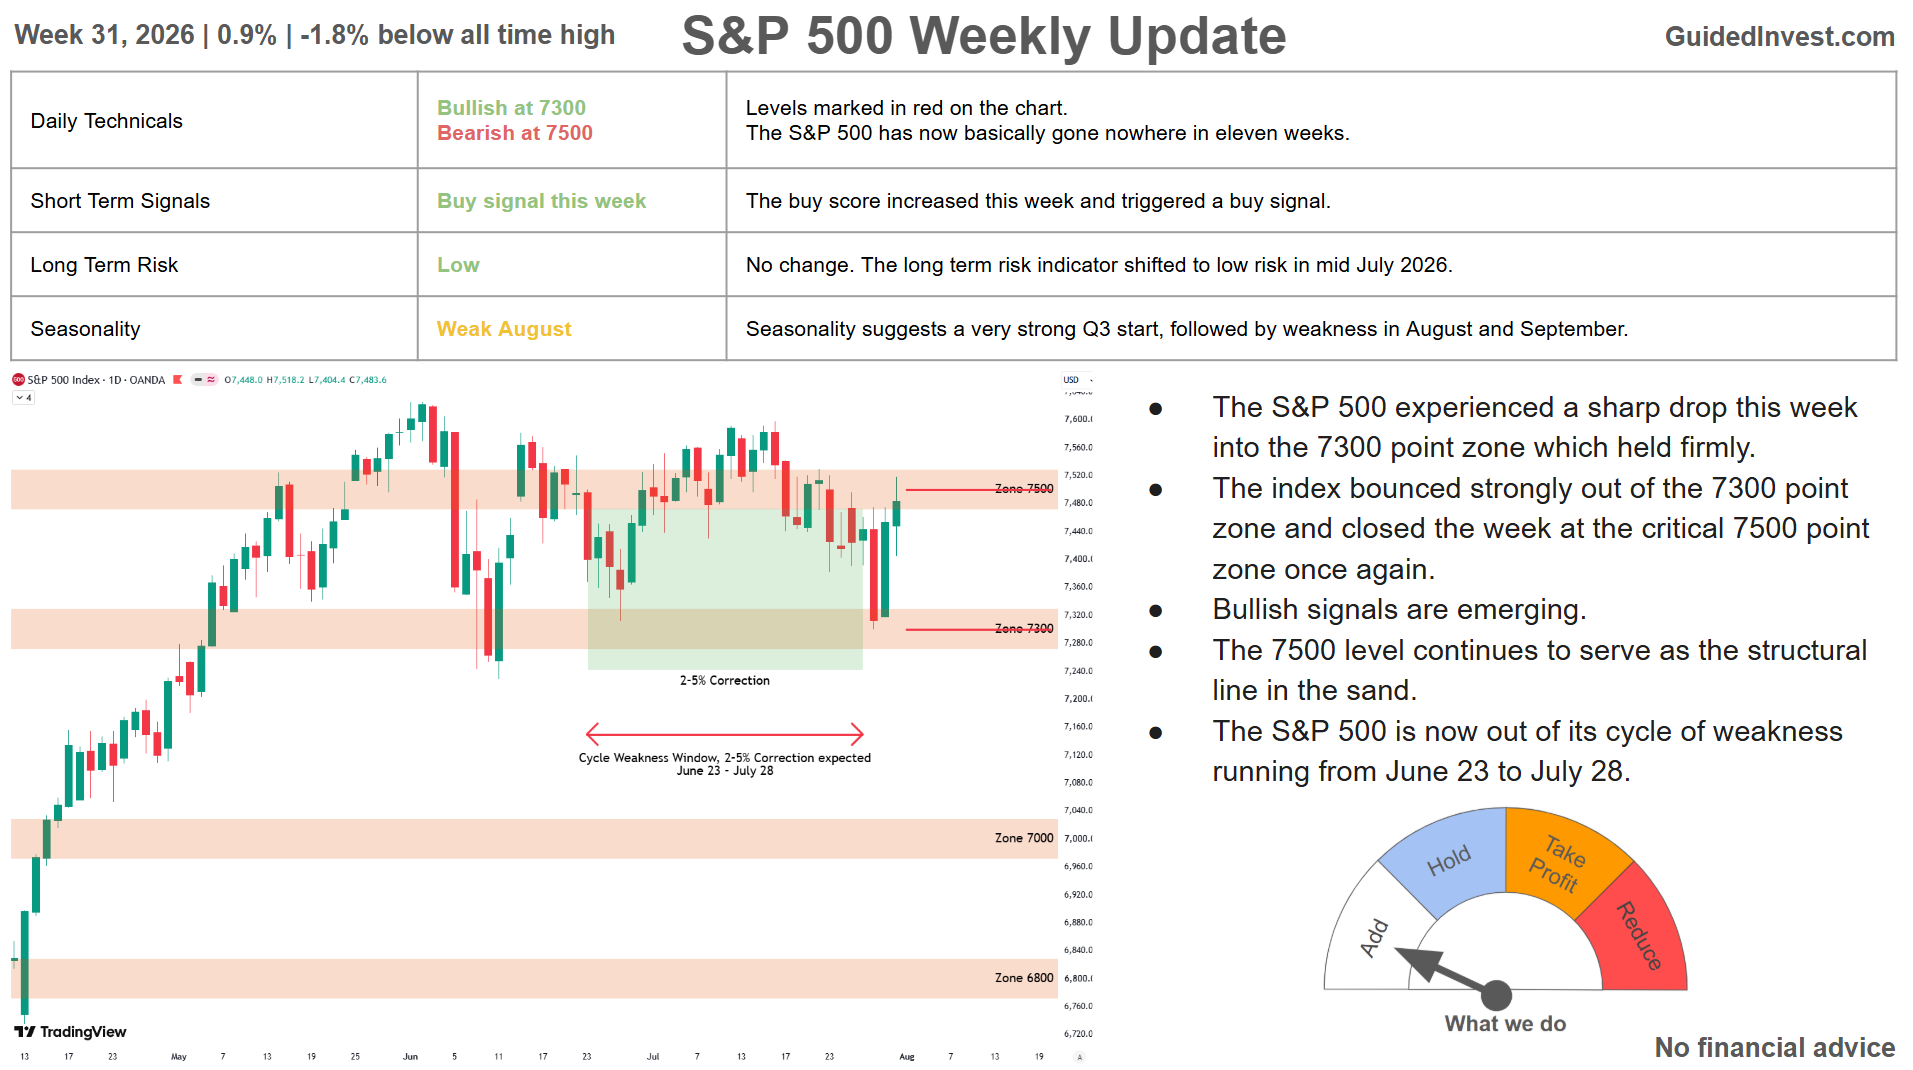
All information summarized in our dashboard:
Stay ahead of the market! Sign up for our weekly updates and get additional expert insights on the S&P 500, key support levels, and market trends.
Leave a Reply