
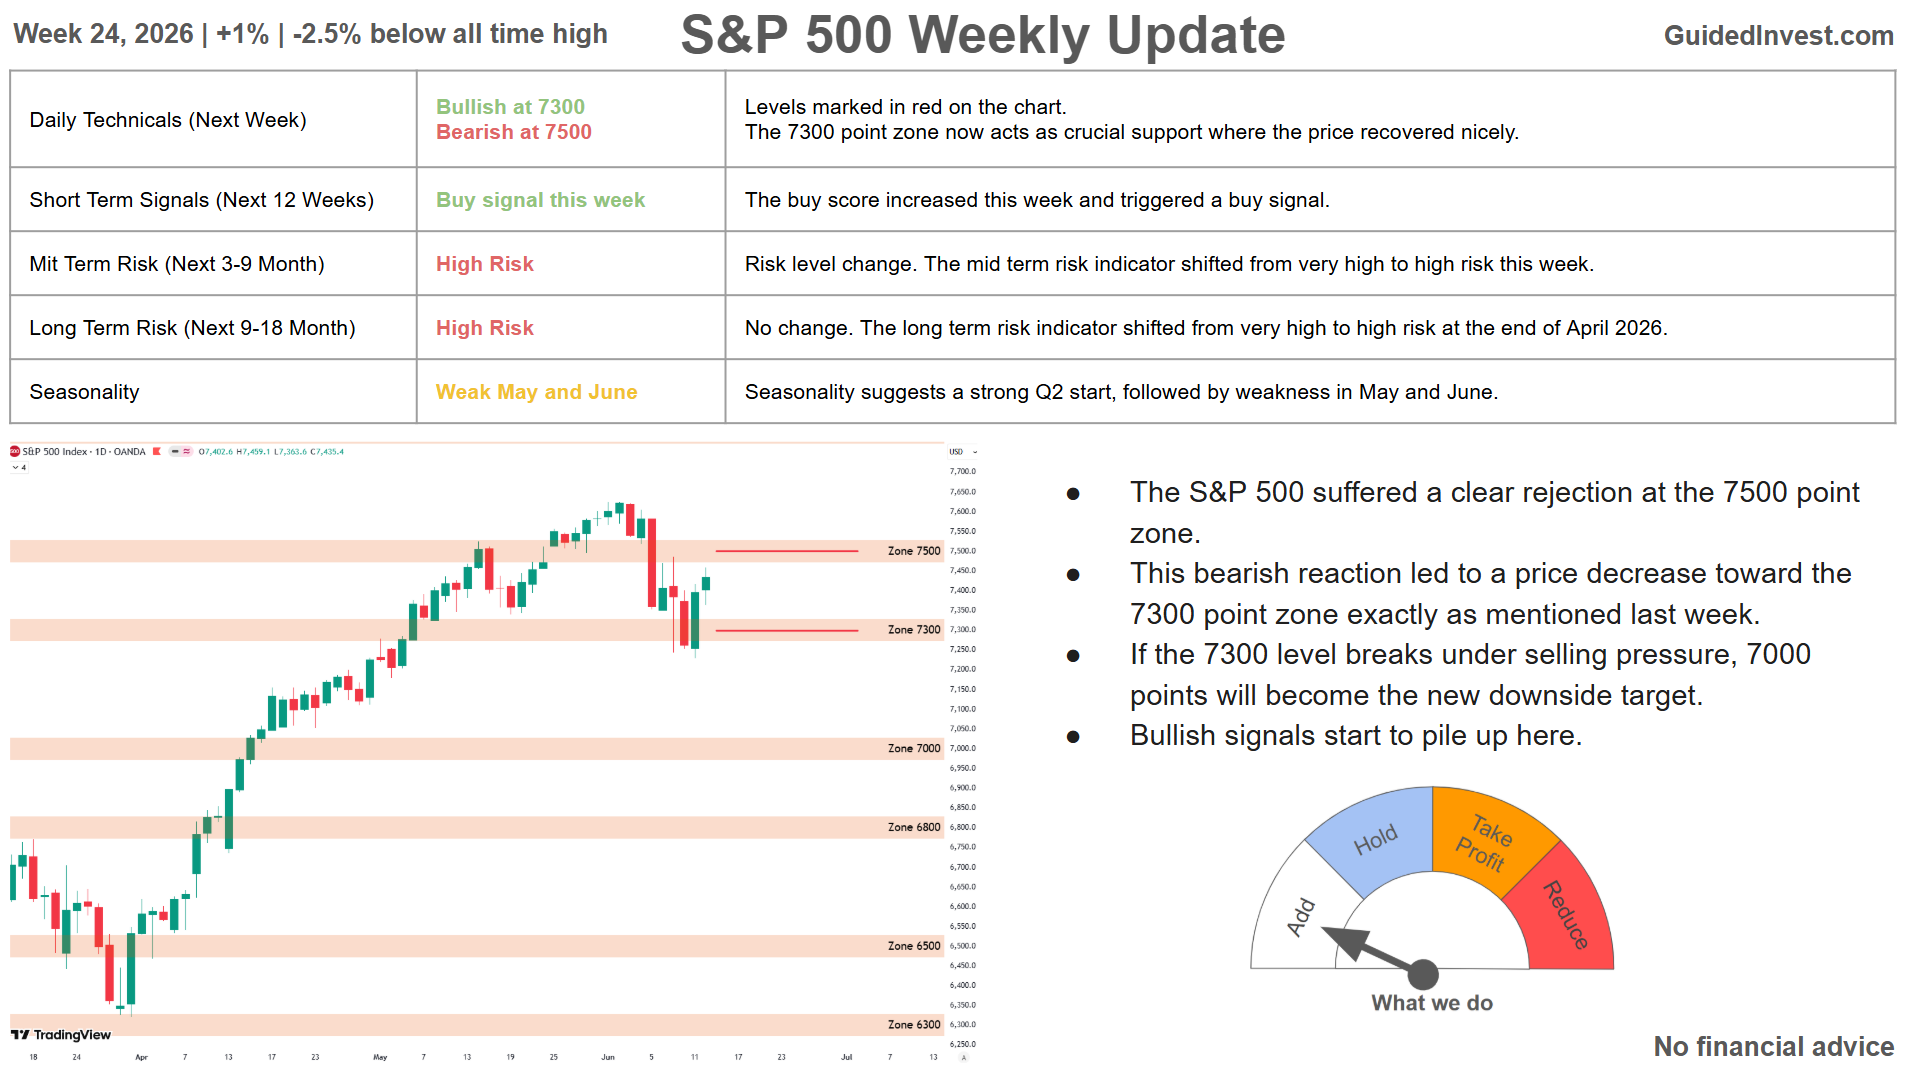
Week 24, 2026 | +1% | -2.5% below all time high
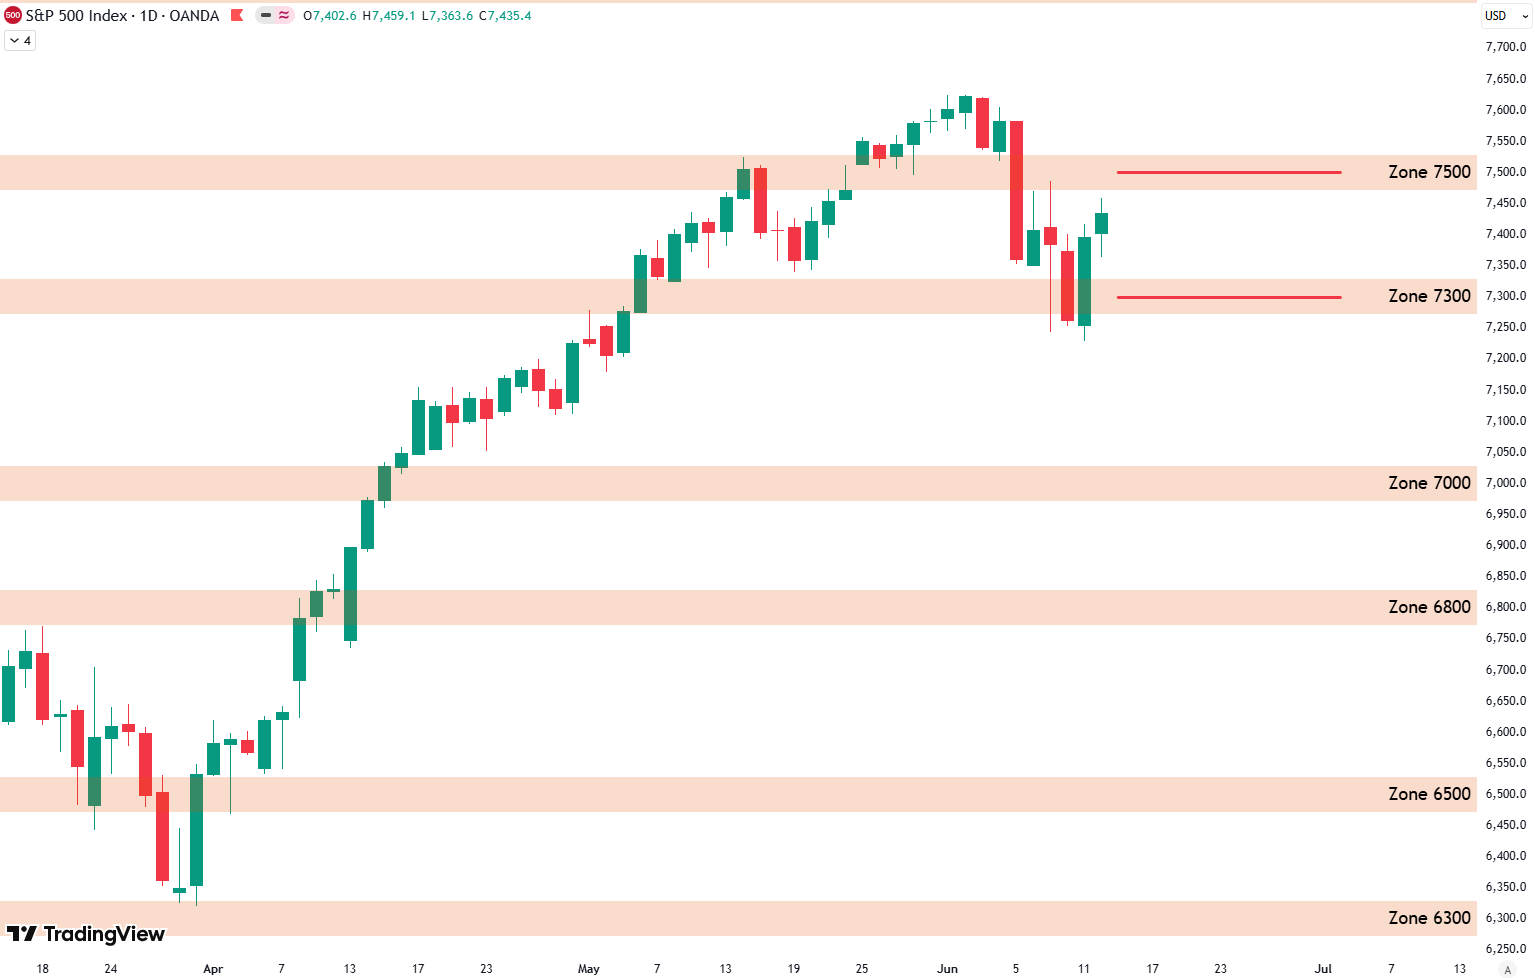
- The S&P 500 suffered a clear rejection at the 7500 point zone.
- This bearish reaction led to a price decrease toward the 7300 point zone exactly as mentioned last week.
- If the 7300 level breaks under selling pressure, 7000 points will become the new downside target.
- Bullish signals start to pile up here.
Daily Technicals (Next Week)
Levels marked in red on the chart.
The 7300 point zone now acts as crucial support where the price recovered nicely.
- Bullish at 7300.
- Bearish at 7500.
Short Term Risk (Next 12 Weeks)
- Buy signal this week.
- The buy score increased this week and triggered a buy signal.
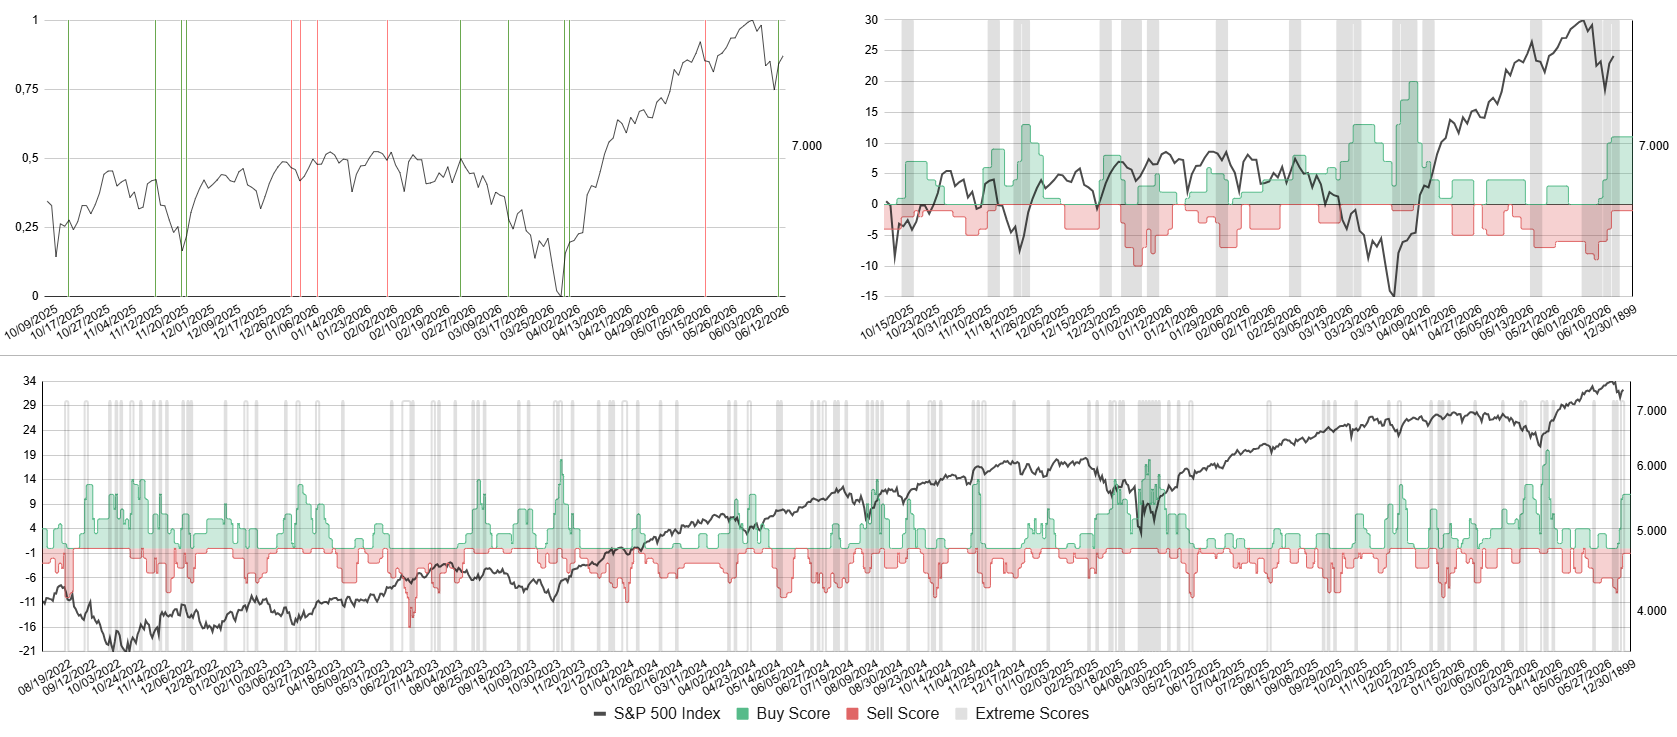
Bottom: Buy score in green, sell score in red, S&P 500 in black.
Top right: Zoomed in version. Top left: Buy and sell signals as vertical lines.
Sign up with your email for free to receive buy and sell signals as soon as they occur:
Mid Term Risk (Next 3-9 Months)
Very Low Risk | Low Risk | Elevated Risk | High Risk | Very High Risk
- Risk level change.
- The mid term risk indicator shifted from very high to high risk this week.
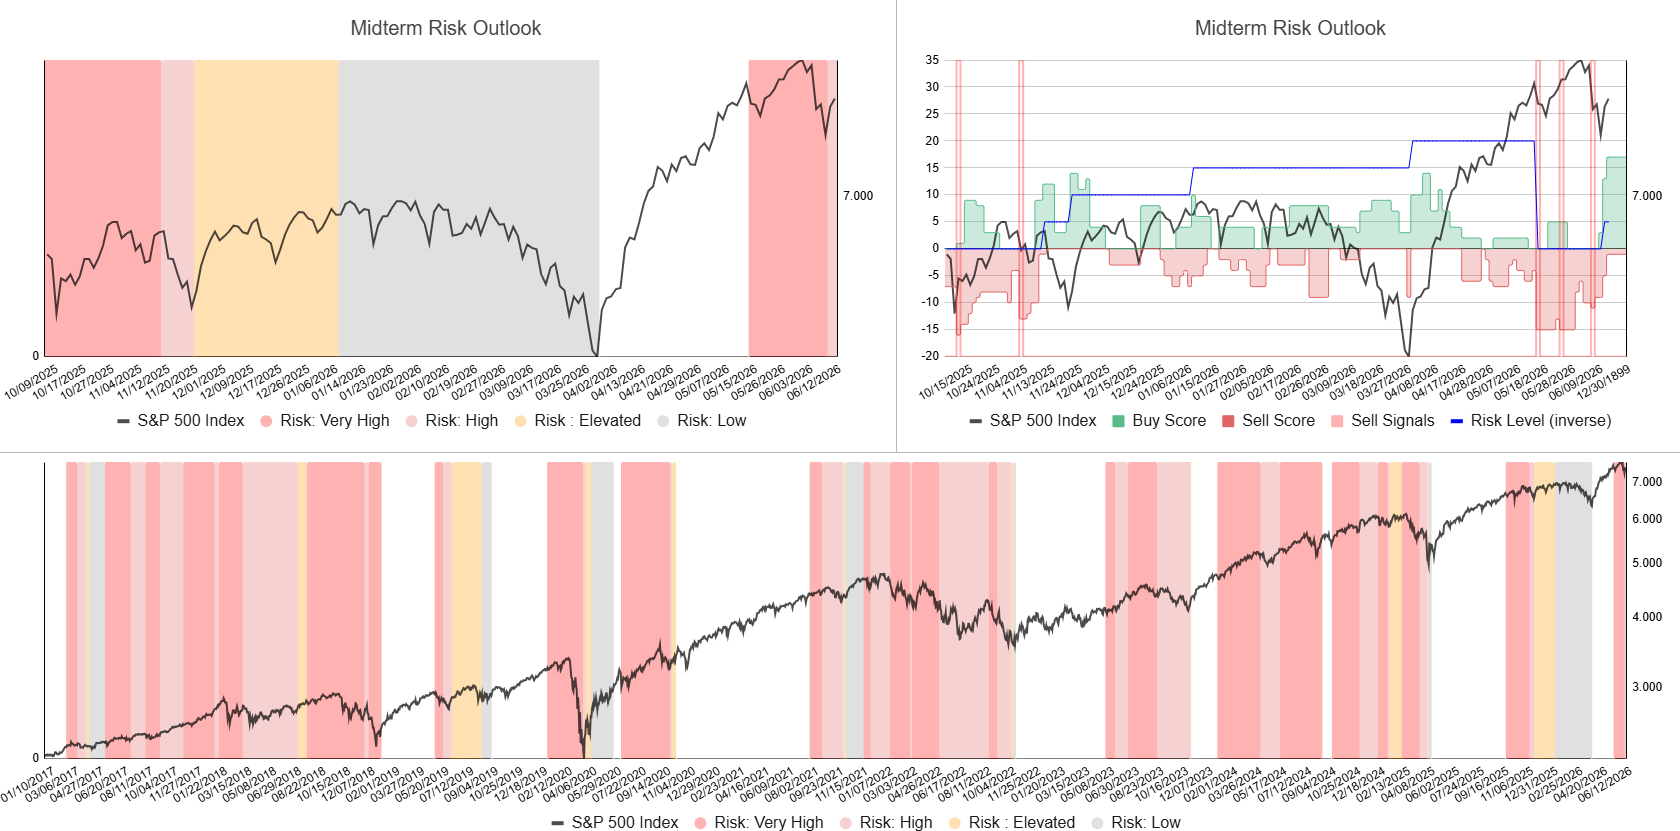
Top: Indicator with internal signals determining risk levels.
Bottom: S&P 500 in black with risk regimes ranging from very low to very high (white, grey, orange and red shaded areas).
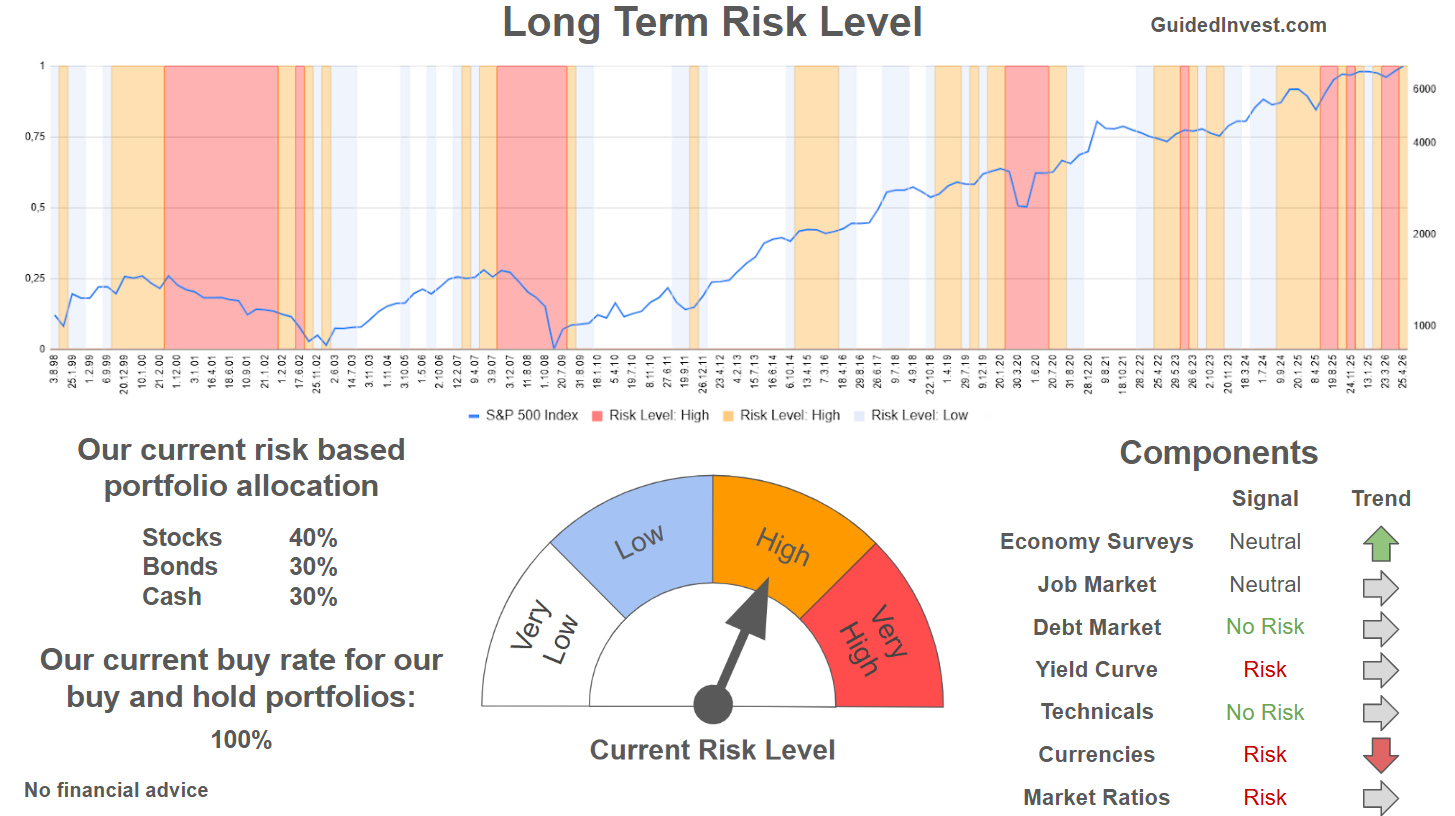
Long Term Risk (Next 9-18 Months)
Very Low Risk | Low Risk | High Risk | Very High Risk
- No change.
- The long term risk indicator shifted from very high to high risk at the end of April 2026.
Seasonality
- Weak May and June
- Seasonality suggests a strong Q2 start, followed by weakness in May and June.

Dashboard
All information summarized in our dashboard:
Stay ahead of the market! Sign up for our weekly updates and get additional expert insights on the S&P 500, key support levels, and market trends.
Leave a Reply