
Week 15, 2026 | +4% | -2.7% below ATH
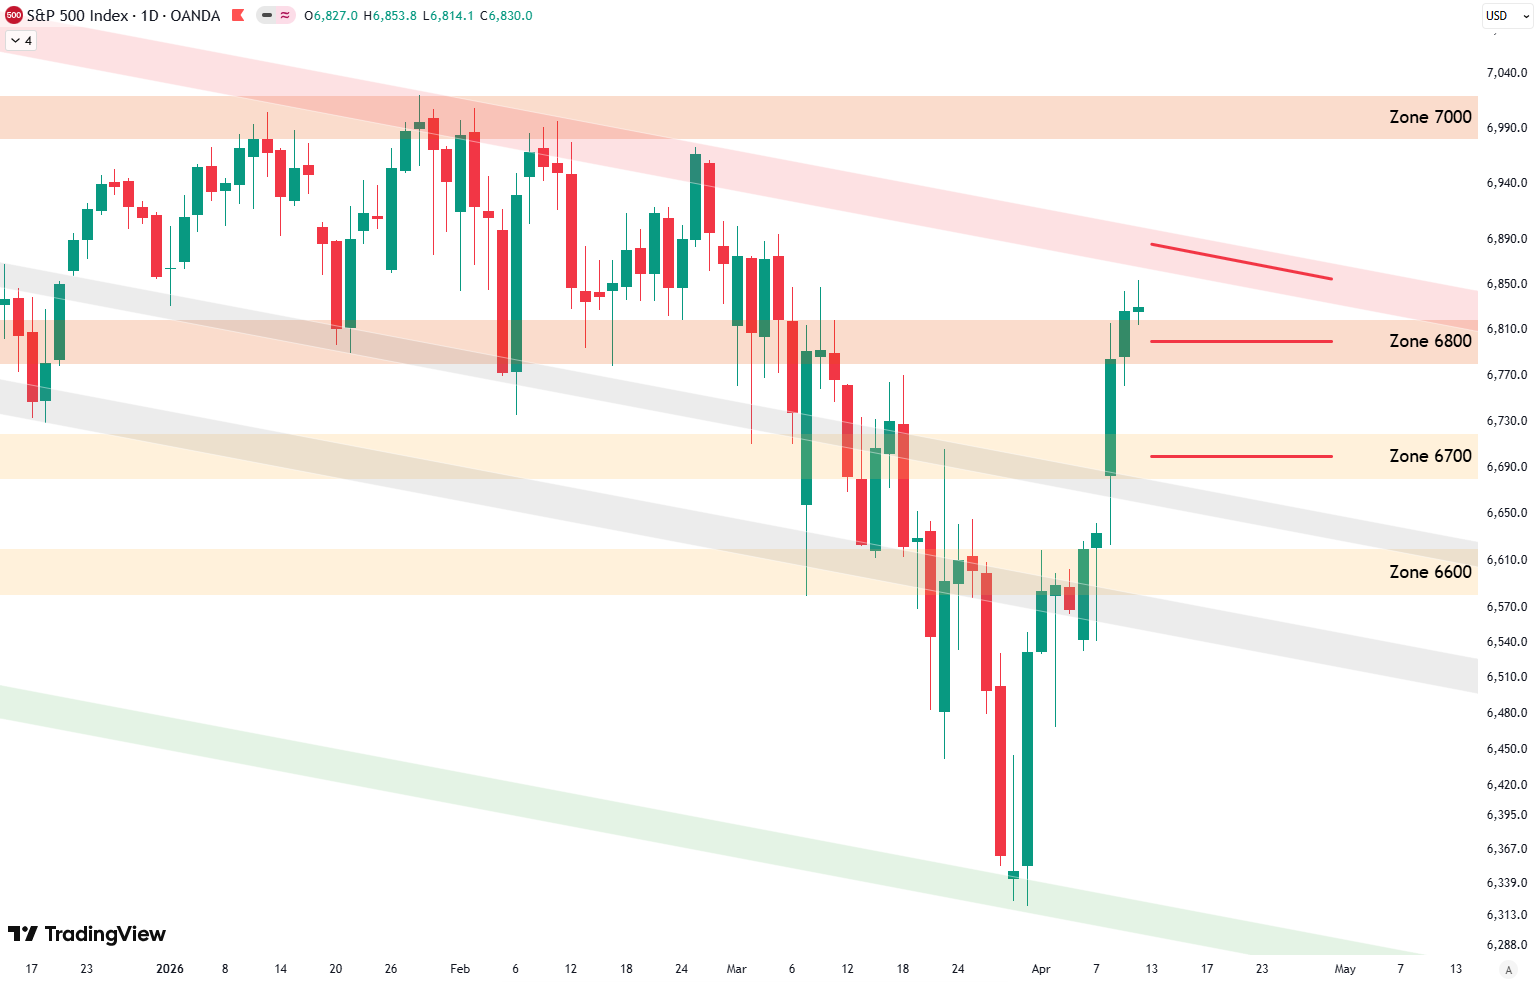
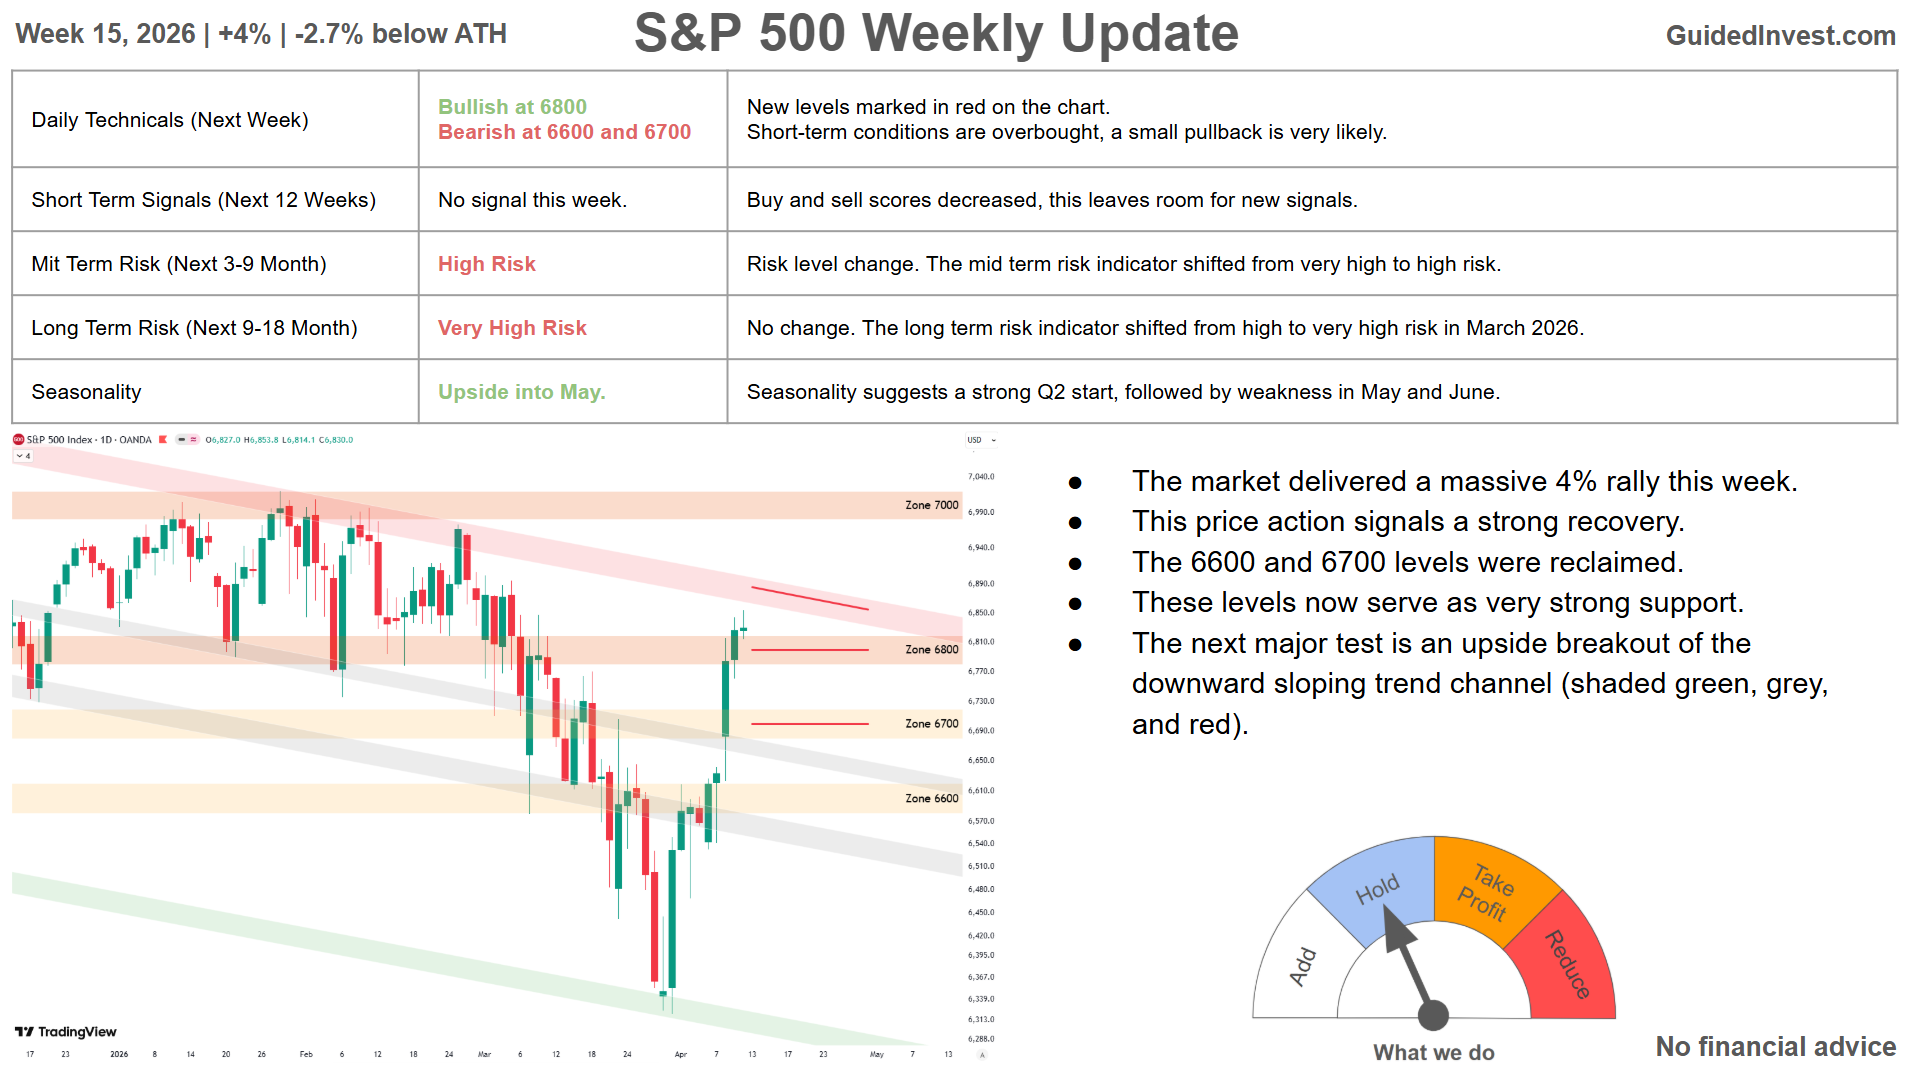
- The market delivered a massive 4% rally this week.
- This price action signals a strong recovery.
- The 6600 and 6700 levels were reclaimed.
- These levels now serve as very strong support.
- The next major test is an upside breakout of the downward sloping trend channel (shaded green, grey, and red).
Daily Technicals (Next Week)
New levels marked in red on the chart.
Short-term conditions are overbought, a small pullback is very likely.
- Bullish at 6800.
- Bearish at red shaded trendline.
Short Term Risk (Next 12 Weeks)
- No signal this week
- Buy and sell scores decreased, this leaves room for new signals.
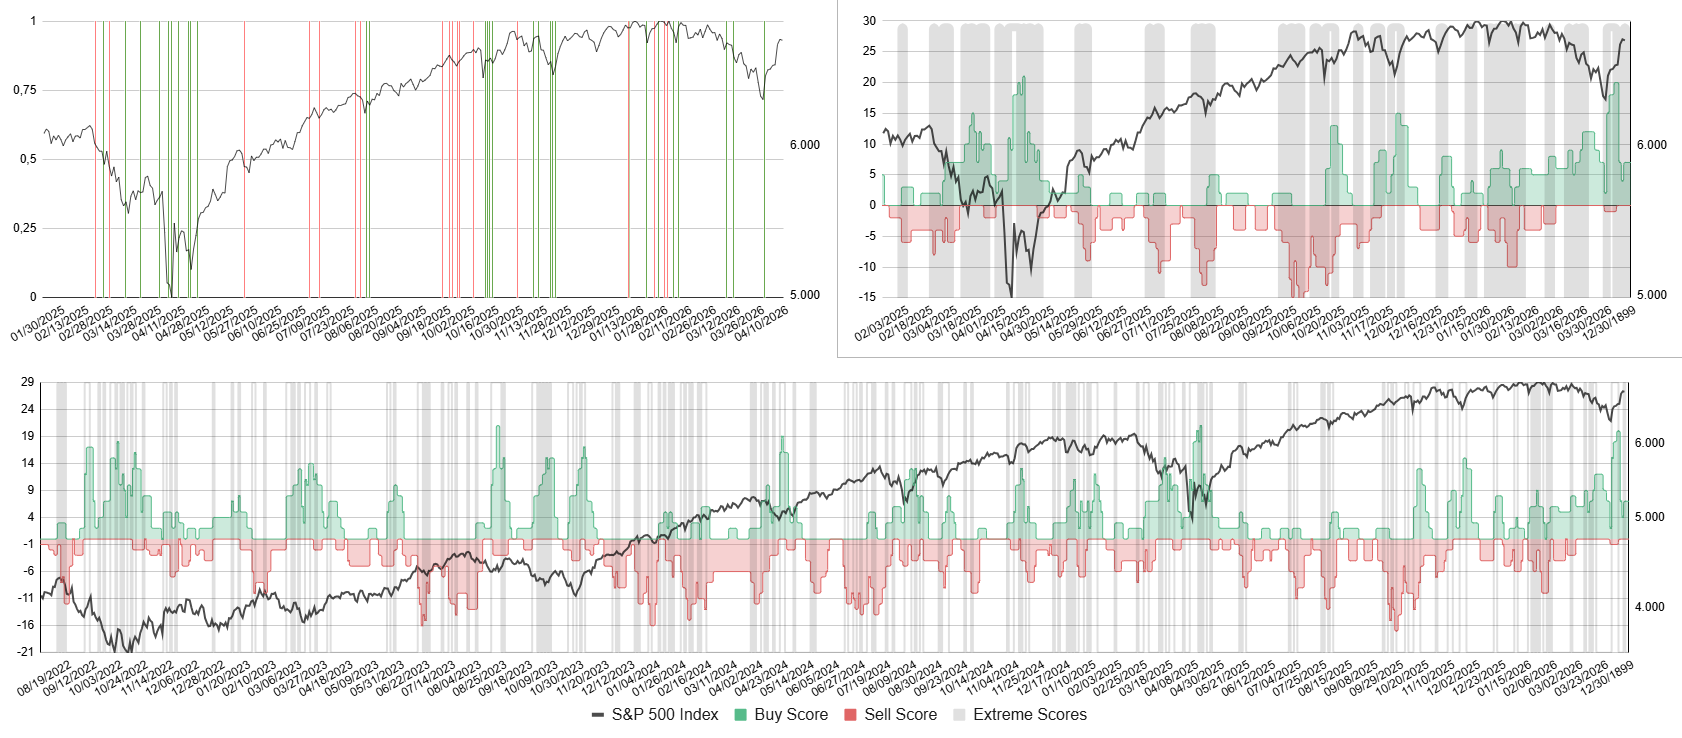
Bottom: Buy score in green, sell score in red, S&P 500 in black.
Top right: Zoomed in version. Top left: Buy and sell signals as vertical lines.
Sign up with your email for free to receive buy and sell signals as soon as they occur:
Mid Term Risk (Next 3-9 Months)
Very Low Risk | Low Risk | Elevated Risk | High Risk | Very High Risk
- Risk level change.
- The mid term risk indicator shifted from very high to high risk.
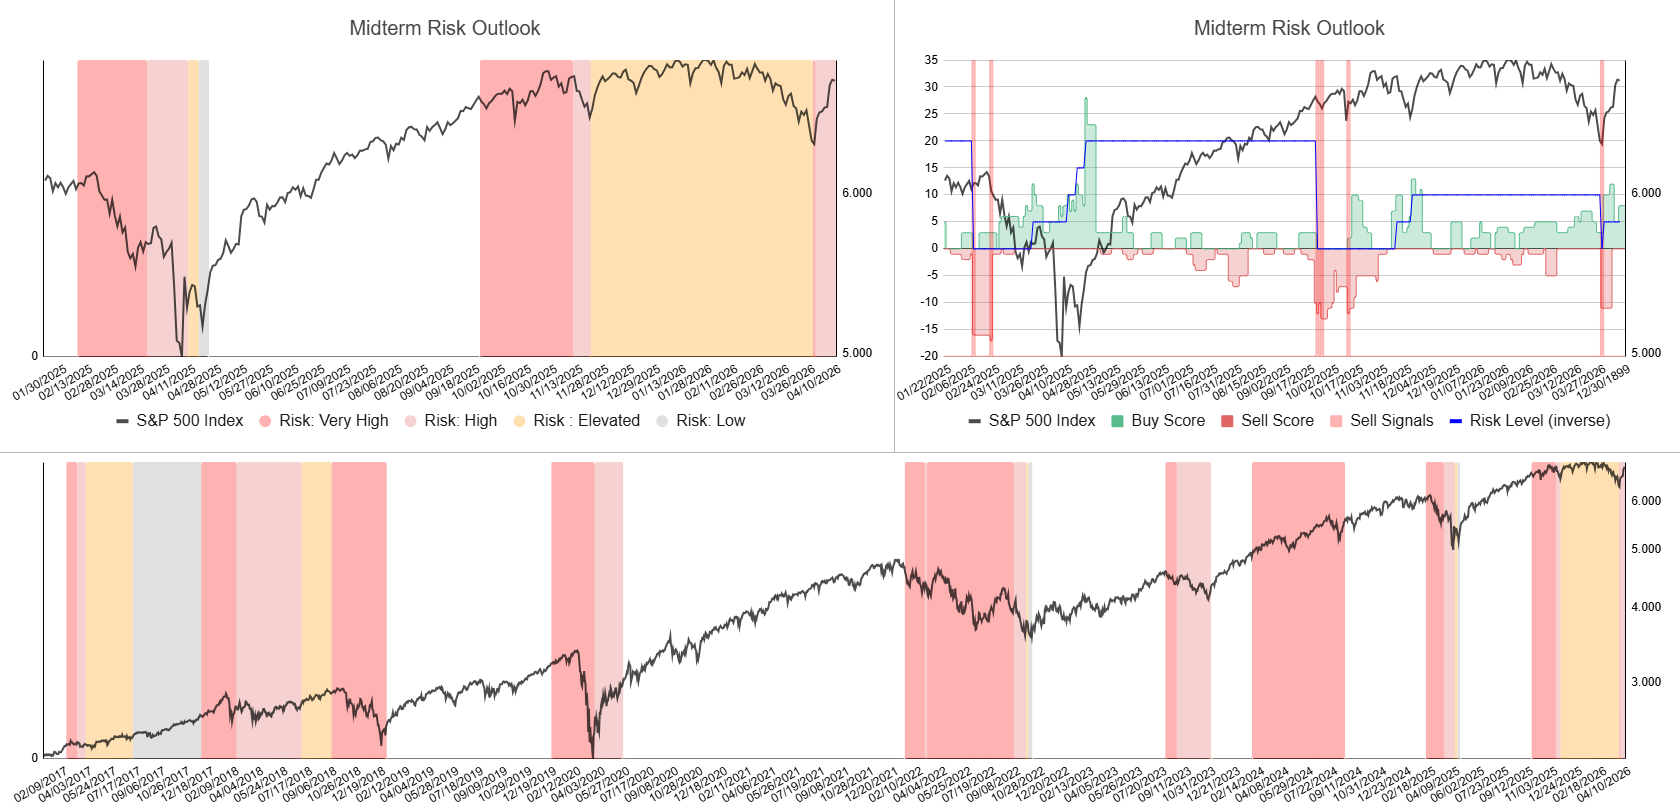
Top: Indicator with internal signals determining risk levels.
Bottom: S&P 500 in black with risk regimes ranging from very low to very high (white, grey, orange and red shaded areas).
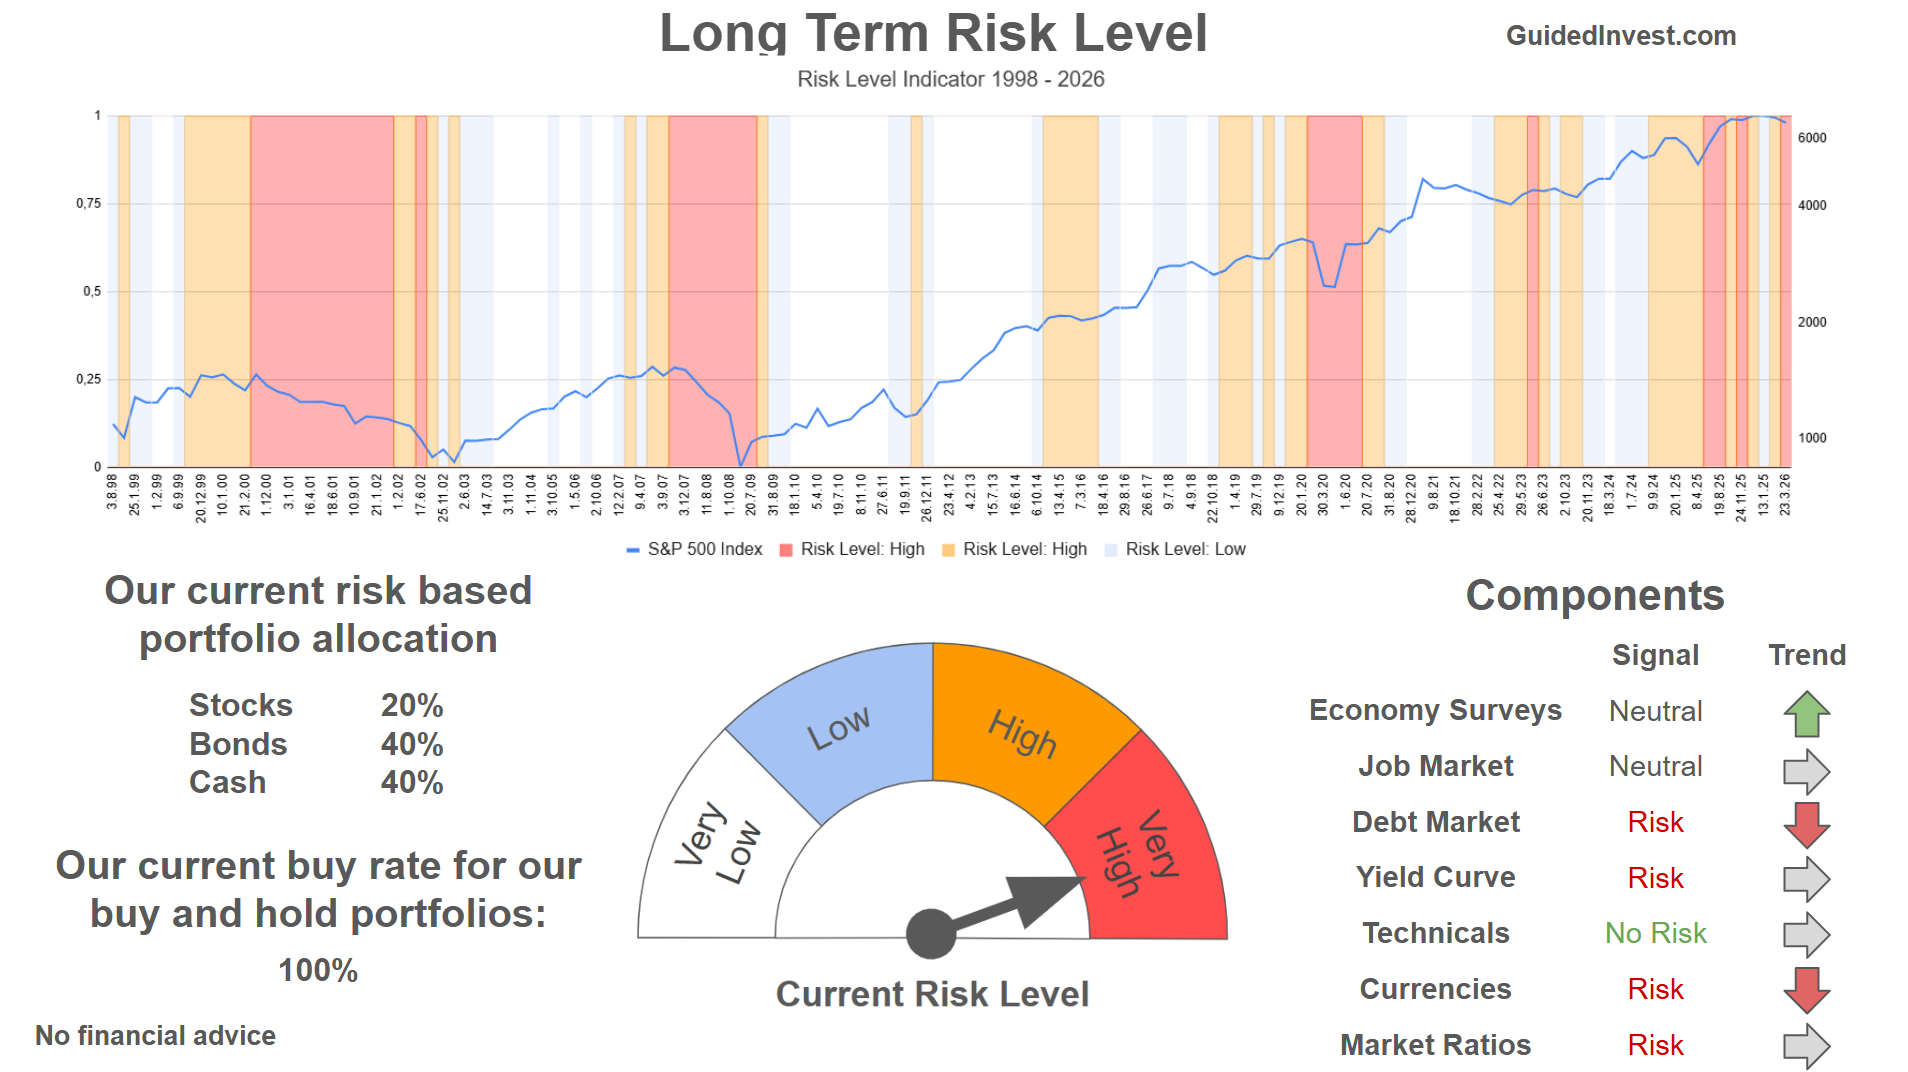
Long Term Risk (Next 9-18 Months)
Very Low Risk | Low Risk | High Risk | Very High Risk
- No change.
- The long term risk indicator shifted from high to very high risk in March 2026.
Seasonality
- Upside movement into May.
- Seasonality suggests a strong Q2 start, followed by weakness in May and June.

Dashboard
All information summarized in our dashboard:
Stay ahead of the market! Sign up for our weekly updates and get additional expert insights on the S&P 500, key support levels, and market trends.
Leave a Reply