
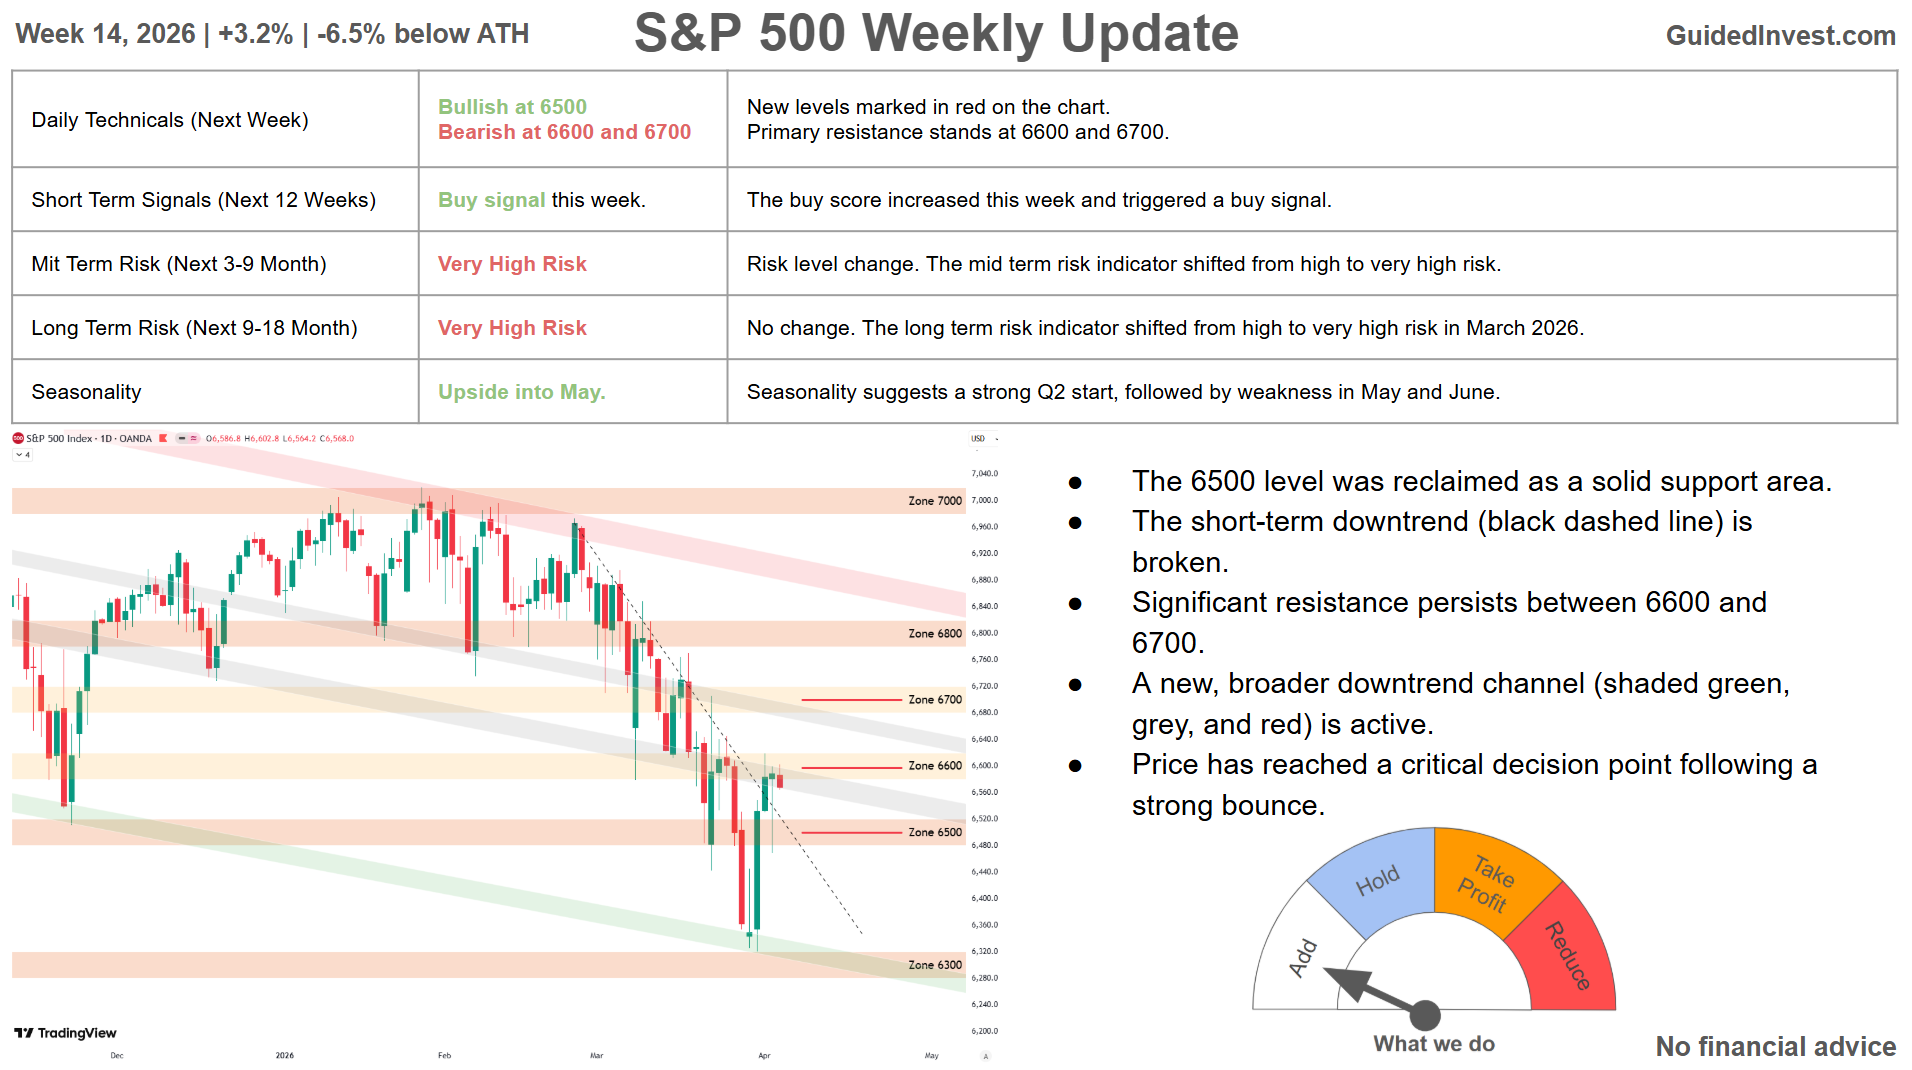
Week 14, 2026 | +3.2% | -6.5% below ATH
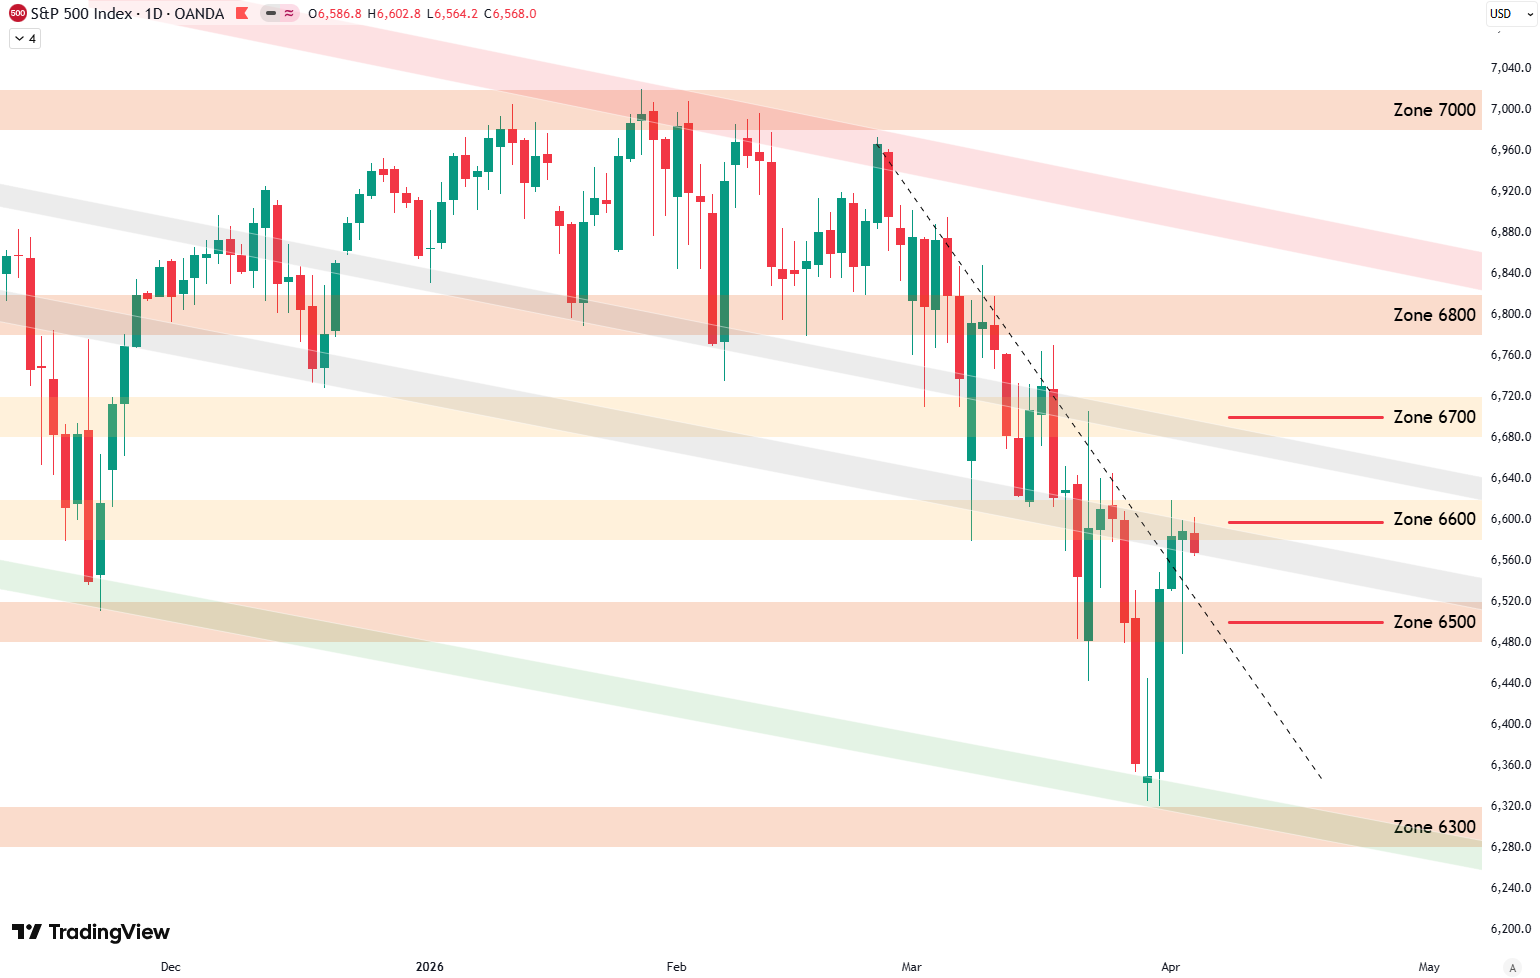
- The 6500 level was reclaimed as a solid support area.
- The short-term downtrend (black dashed line) is broken.
- Significant resistance persists between 6600 and 6700.
- A new, broader downtrend channel (shaded green, grey, and red) is active.
- Price has reached a critical decision point following a strong bounce.
Daily Technicals (Next Week)
New levels marked in red on the chart.
Primary resistance stands at 6600 and 6700.
- Bullish at 6500
- Bearish at 6600 and 6700
Short Term Risk (Next 12 Weeks)
- Buy signal this week.
- The buy score increased this week and triggered a buy signal.
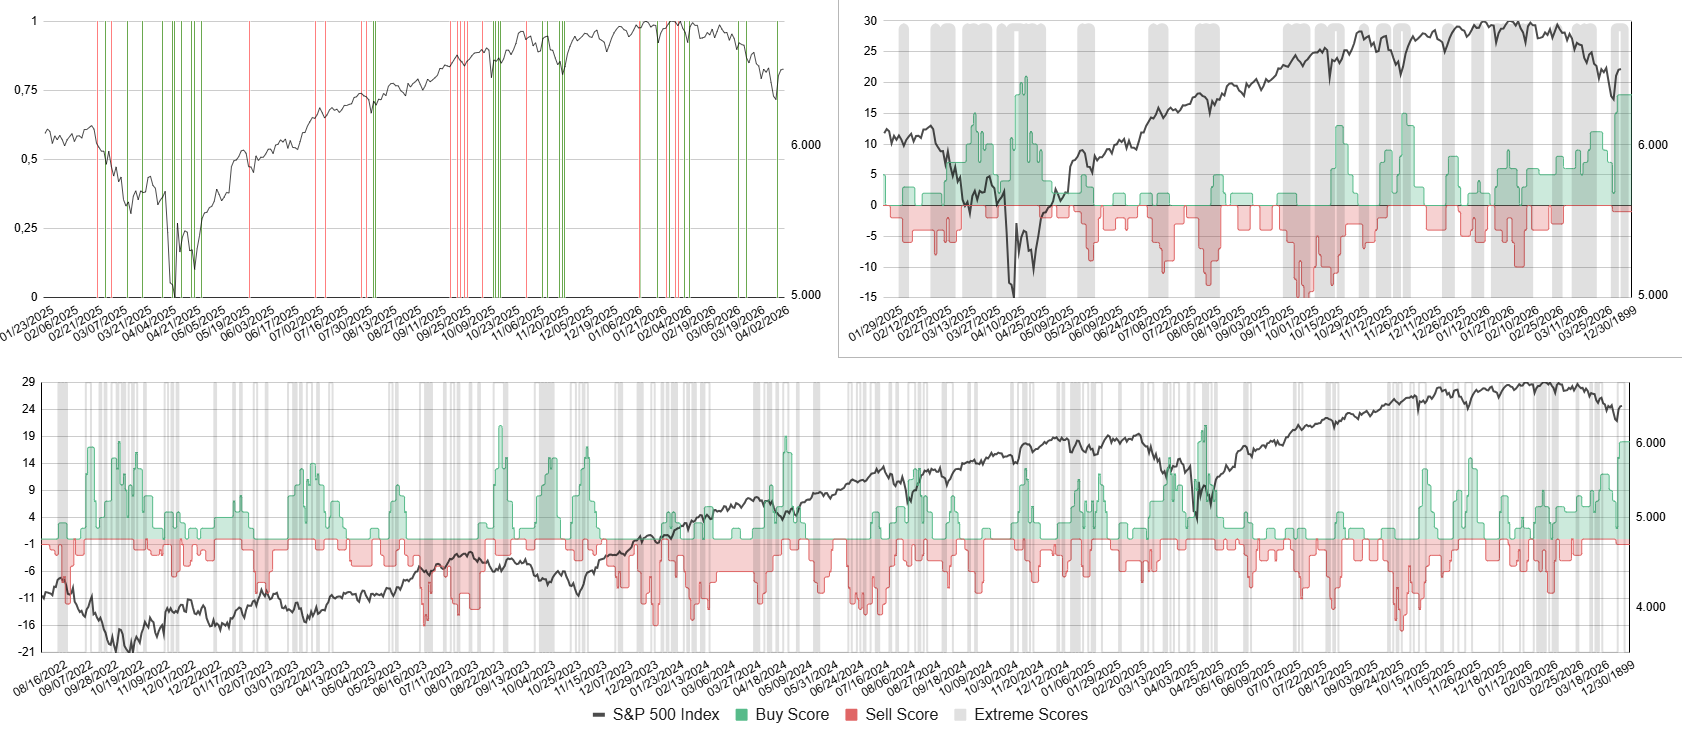
Bottom: Buy score in green, sell score in red, S&P 500 in black.
Top right: Zoomed in version. Top left: Buy and sell signals as vertical lines.
Sign up with your email for free to receive buy and sell signals as soon as they occur:
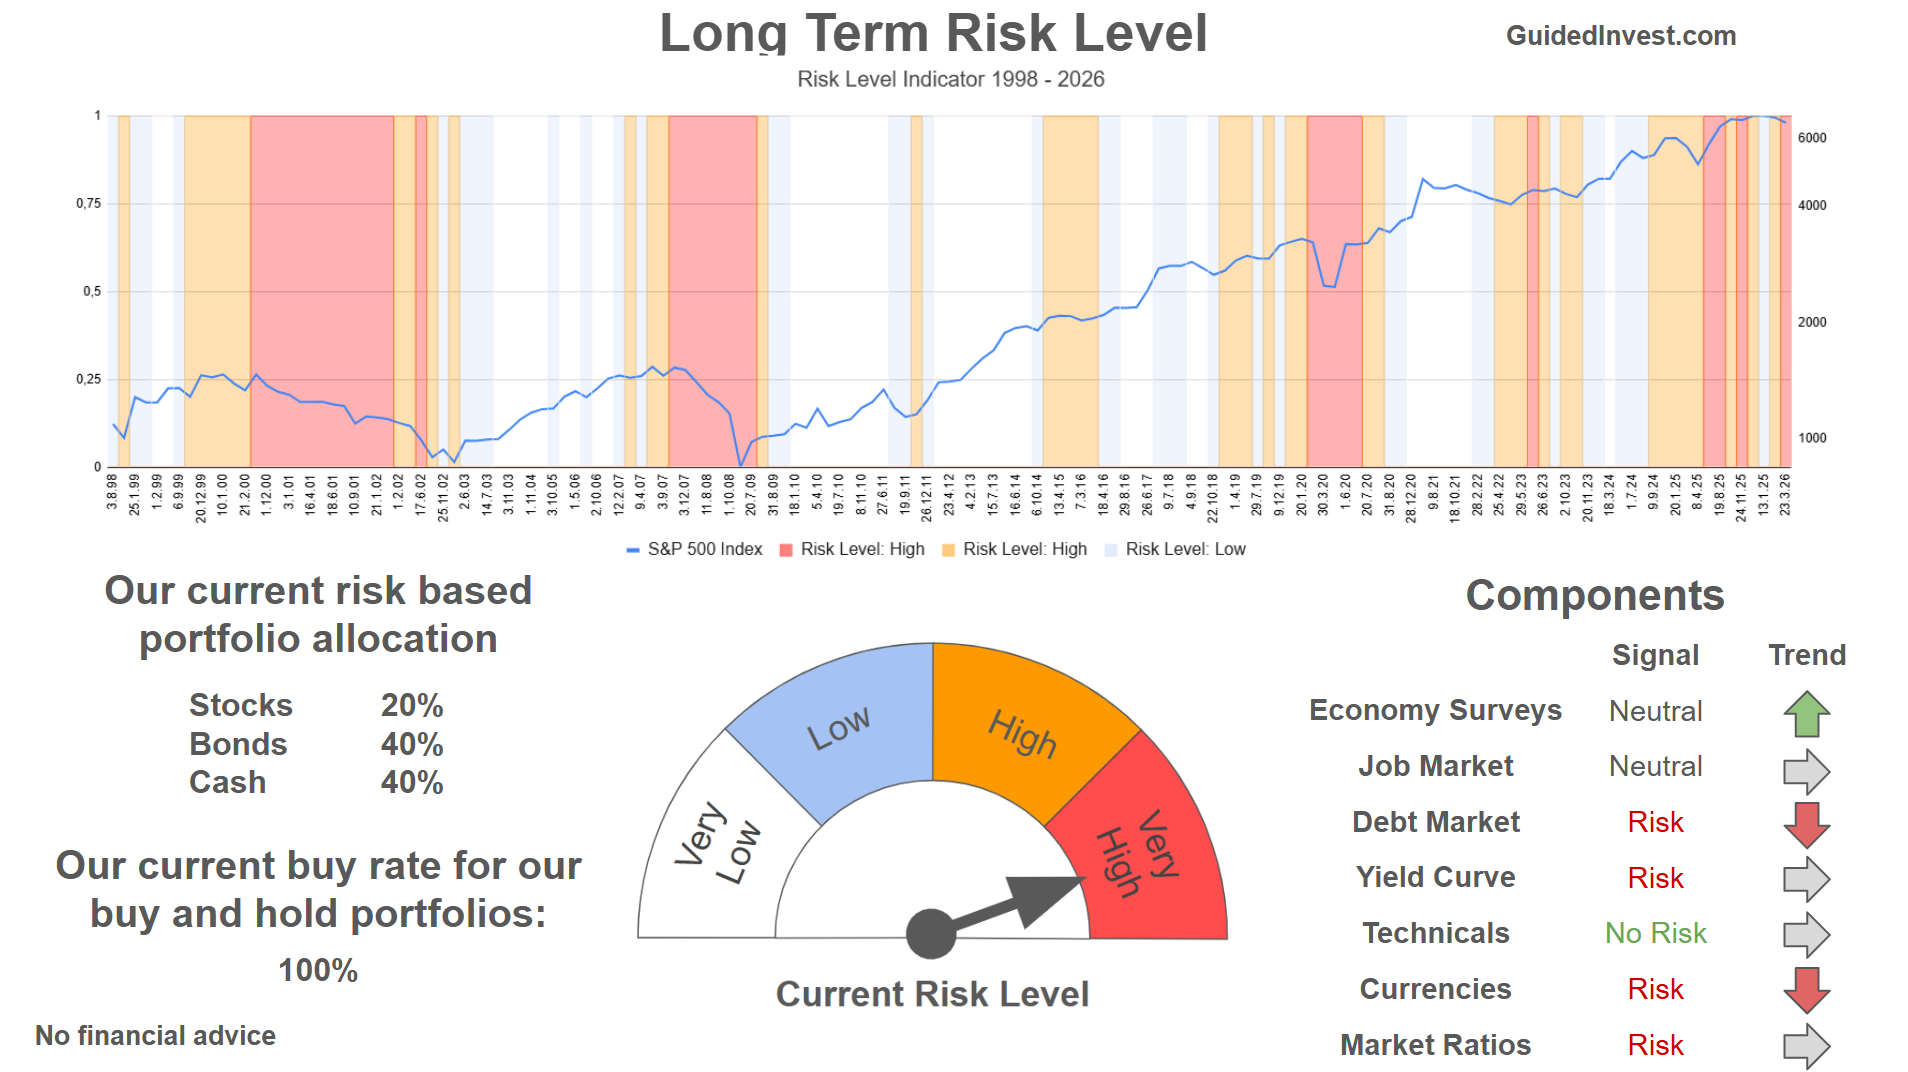
Mid Term Risk (Next 3-9 Months)
Very Low Risk | Low Risk | Elevated Risk | Very High Risk
- Risk level change.
- The mid term risk indicator shifted from high to very high risk.

Top: Indicator with internal signals determining risk levels.
Bottom: S&P 500 in black with risk regimes ranging from very low to very high (white, grey, orange and red shaded areas).
Long Term Risk (Next 9-18 Months)
Very Low Risk | Low Risk | High Risk | Very High Risk
- No change.
- The long term risk indicator shifted from high to very high risk in March 2026.
Seasonality
- Upside movement into May.
- Seasonality suggests a strong Q2 start, followed by weakness in May and June.

Dashboard
All information summarized in our dashboard:
Stay ahead of the market! Sign up for our weekly updates and get additional expert insights on the S&P 500, key support levels, and market trends.
Leave a Reply