
Since hitting a low in October 2022, Meta’s stock has seen an extraordinary rise of 500%, outpacing many of its peers in the tech sector. This dramatic rebound underscores Meta’s resilience as the company continues to recover from challenges it faced in the preceding years.
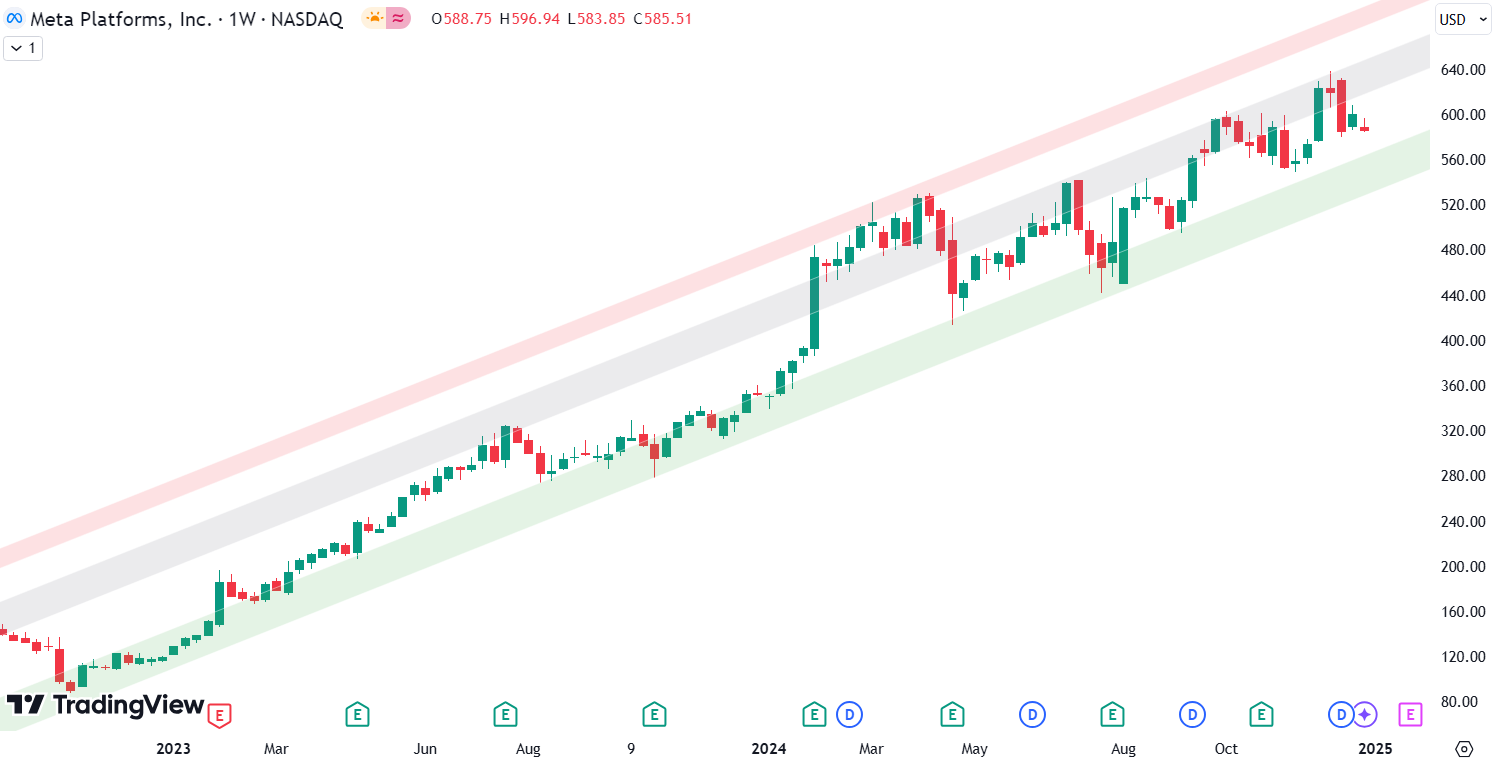
Examining the weekly chart, we observe three key parallel trendlines—green, grey, and red—which have defined the long-term uptrend. The green trendline has consistently marked the lower boundary of the trend channel, providing significant support for price pullbacks over the past two years. Each touch of this line presented opportunities for investors to reenter the trend.
The grey line, which runs through the middle of the channel, has acted as both support and resistance at different times, underscoring its role as a balance point within the uptrend. Meanwhile, the red trendline at the top of the channel signals resistance; prices often encounter difficulty moving beyond this line, frequently reversing afterward.
Are you wondering when to buy Meta as an investor? Explore our tailored services and join our growing community of do-it-yourself investors who have successfully navigated the market with our guidance.
Premium Guide
Advanced Investing Signals
Basic Guide
Basic Investing
Signals
Simple Guide
Selected
Signals
Congratulations! You’ve discovered your new free financial guide. Sign up for our most popular service, the Simple Guide.
Closer Look: Daily Chart Insights
Shifting to the daily chart provides a closer perspective on Meta’s movements over recent months. The trendlines—green, grey, and red—continue to guide price actions on shorter timeframes. Notably, a horizontal support area, marked on the chart as a green support zone, has aligned with the green trendline.
This alignment suggests the green zone as a potential support area. Historically, similar intersections have provided solid foundations for continued upward moves. While the broader trend remains firmly bullish, this support zone could prove pivotal in determining Meta’s next steps within the trend channel.

Meta’s Momentum Compared to Peers
The sheer magnitude of Meta’s 500% rise sets it apart from many tech giants over the same period. While major companies like Alphabet, Apple, and Amazon have seen robust recoveries since the 2022 market lows, Meta’s performance is unparalleled.
The world of finance can be complex, with many technical terms. For explanations of financial terminology, try using the Investopedia dictionary.
Leave a Reply