
Alibaba, the Chinese e-commerce giant, has been making some interesting moves on the stock market lately, and if you’re a beginner investor, this might be a stock to keep an eye on. Let’s break down what’s been happening with Alibaba’s stock since May 2024 and why now could be a great time to consider an entry.
Are you wondering when to buy Alibaba as an investor? Explore our tailored services and join our growing community of do-it-yourself investors who have successfully navigated the market with our guidance.
Premium Guide
Advanced Investing Signals
$139 / Month
Basic Guide
Basic Investing
Signals
$49 / Month
Simple Guide
Selected
Signals
Free
Congratulations! You’ve discovered your new free financial guide. Simply sign up for our most popular service, our Simple Guide.
Slow Start, Big Jump: What Happened Since May 2024?
Looking at Alibaba’s daily stock chart starting from May 2024, it was pretty quiet. The stock didn’t show much movement for several months, trading sideways without any significant price changes. However, things changed dramatically in September 2024.
In just a few weeks, Alibaba’s stock surged by over 40%. That’s a huge move for such a large company, but like all stocks, what goes up must come down—or at least pause for a breather. Over the last few days, Alibaba’s stock has pulled back a bit after hitting resistance.
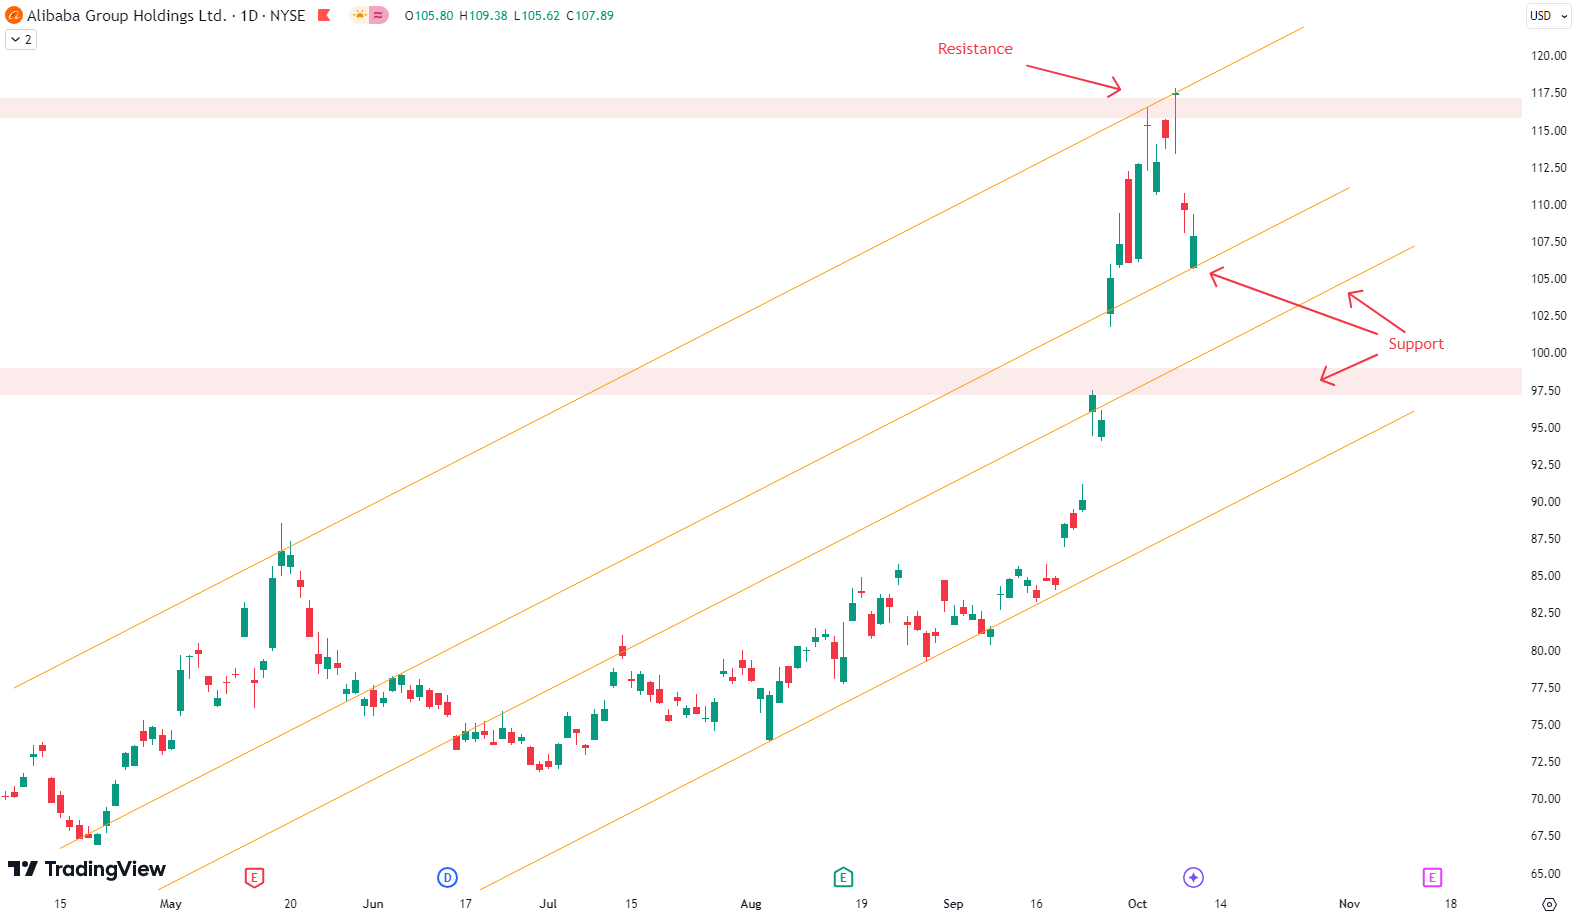
Resistance: Where the Rally Stopped
Resistance is a price level where a stock struggles to move higher. On Alibaba’s chart, two key areas were acting as resistance—one was a horizontal resistance zone (shown in red), and the other was an orange trendline. When both of these barriers converged, the stock price hit a wall and began to fall back.
This drop in price over the past few days is pretty normal after a big run-up. However, the pullback could be presenting a fresh opportunity for investors to jump in at a lower price.
Potential Support Levels: Where Could Alibaba Bounce Back?
Now, the big question is: Where will Alibaba find support?
In technical analysis, support refers to price levels where a stock tends to stop falling and starts bouncing back. Alibaba has several potential support levels to watch:
- Trendline support: After falling from the resistance, Alibaba is now approaching a trendline that could act as support. If the price bounces here, it could be a good sign that the stock is gearing up for another run.
- Lower trendline: If the first trendline doesn’t hold, there’s another one below it that might step in to stop the decline.
Horizontal support zone: This is a key area further down the chart where the stock has previously found a lot of buyers. If Alibaba falls to this level, it might attract investors looking for a bargain, pushing the price back up.
What’s Next for Alibaba?
If Alibaba finds support at any of these levels, it could start climbing again, possibly breaking past its previous resistance levels and making new highs. For beginner investors, this could be a good entry point. Watching how the stock reacts at these support levels in the coming days will be crucial for anyone considering getting involved.
A Potential Buying Opportunity?
Alibaba’s recent price action presents an interesting case for investors. With the stock pulling back after a massive rally, the upcoming days or weeks might offer new buying opportunities if support holds. Whether or not it makes new highs depends on how the stock handles the resistance and support zones mentioned above.
If you’re new to investing, Alibaba’s chart gives a great example of how stocks move between support and resistance, and why it’s important to watch for these levels when making investment decisions.
The world of finance is complex and includes many technical terms. For explanations of these terms, I recommend using the Investopedia dictionary.
Leave a Reply