Tag: #SPY
-

Weekly Update S&P 500
Hello everyone! This week was another eventful one for the S&P 500. Looking at the 4-hour chart, we can see some major market movements. The week kicked off with a sharp drop of 1.8% at the open on Monday, meaning the market opened significantly lower than Friday’s close. However, what happened next was impressive: the…
-

Weekly Update S&P 500
Welcome to our weekly newsletter on the S&P 500. This week, the S&P 500 posted a loss of 1.1%. As shown in the 4‑hour chart covering the last couple of weeks, we saw a strong upward trend that suddenly met some turbulence. Over the weekend, new information emerged about China’s AI DeepSeek—a model that promises…
-

Weekly Update S&P 500
The S&P 500 had an impressive week, gaining 1.5% as it maintained its recent bullish momentum. Examining the 4-hour chart (with each candle representing 4 hours), we saw significant action unfold. After some volatility early in the week, the index finished on a strong note heading into Friday. The last two weeks have been especially…
-

Weekly Update S&P 500
Welcome to this week’s S&P 500 newsletter! The week kicked off with strength, delivering some much-needed optimism after a rough prior week. While the S&P 500 ended the previous week with a 2.0% decline, we saw a strong recovery of 3.0% this week. Monday’s rally set the tone, and the momentum carried into Wednesday. For…
-

Weekly Update S&P 500
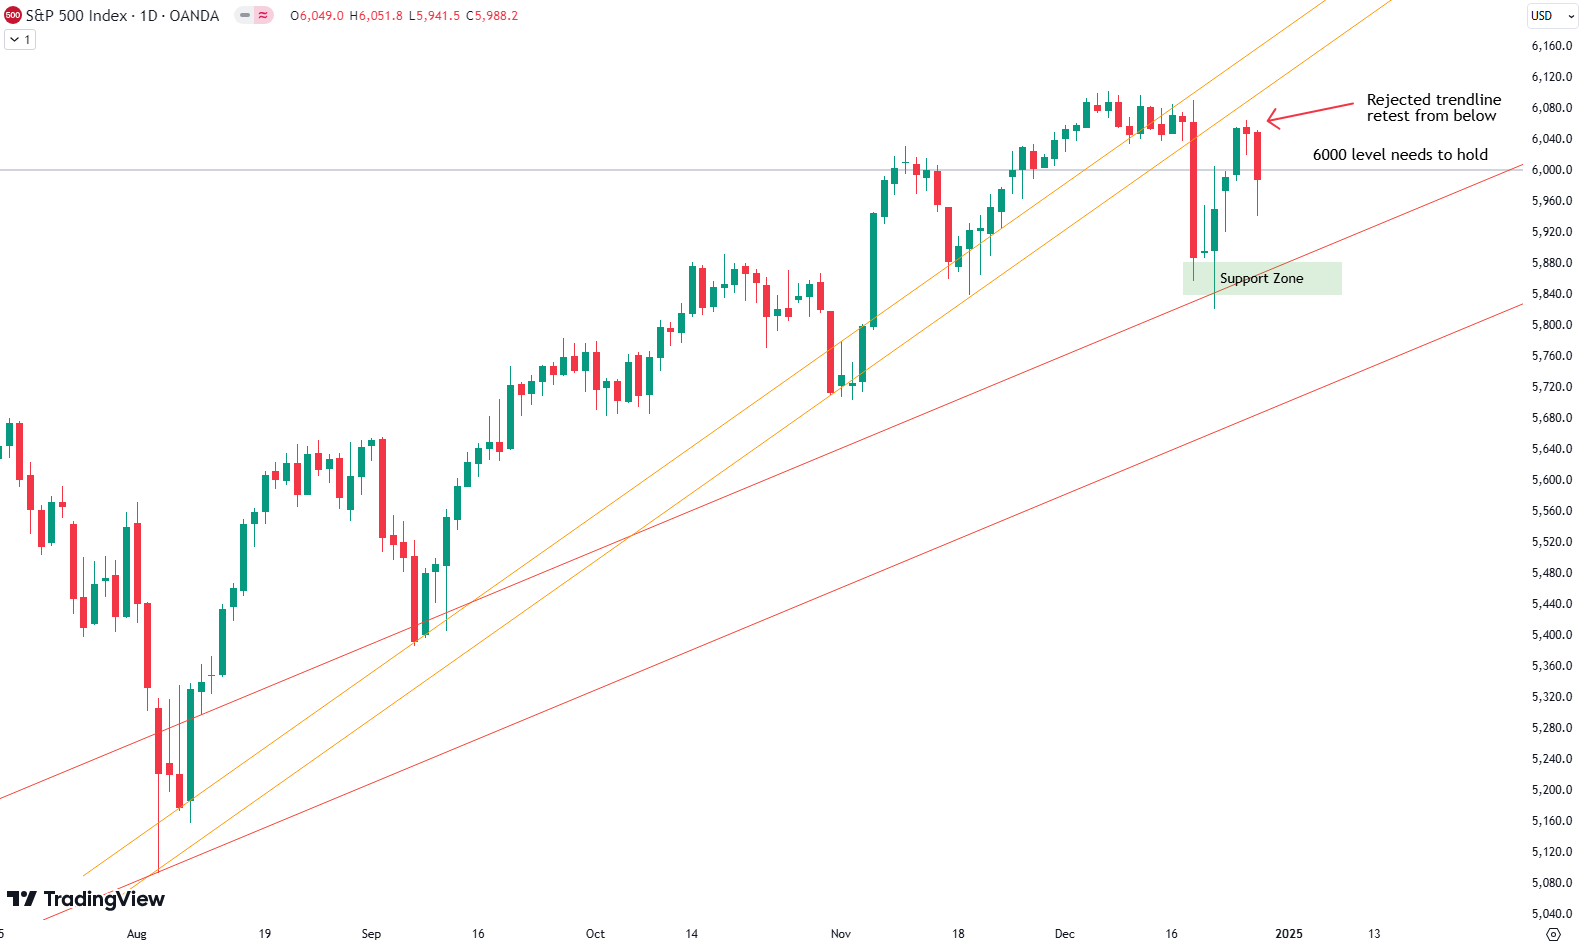
Welcome to our weekly S&P 500 analysis. This week, the market saw a significant decline, with the index losing 2%. Last week, we anticipated another test of the key 6,000-point psychological level, and that’s precisely what happened earlier this week. The S&P 500 attempted to break above this barrier on Monday and Tuesday, only to…
-
Weekly Update S&P 500
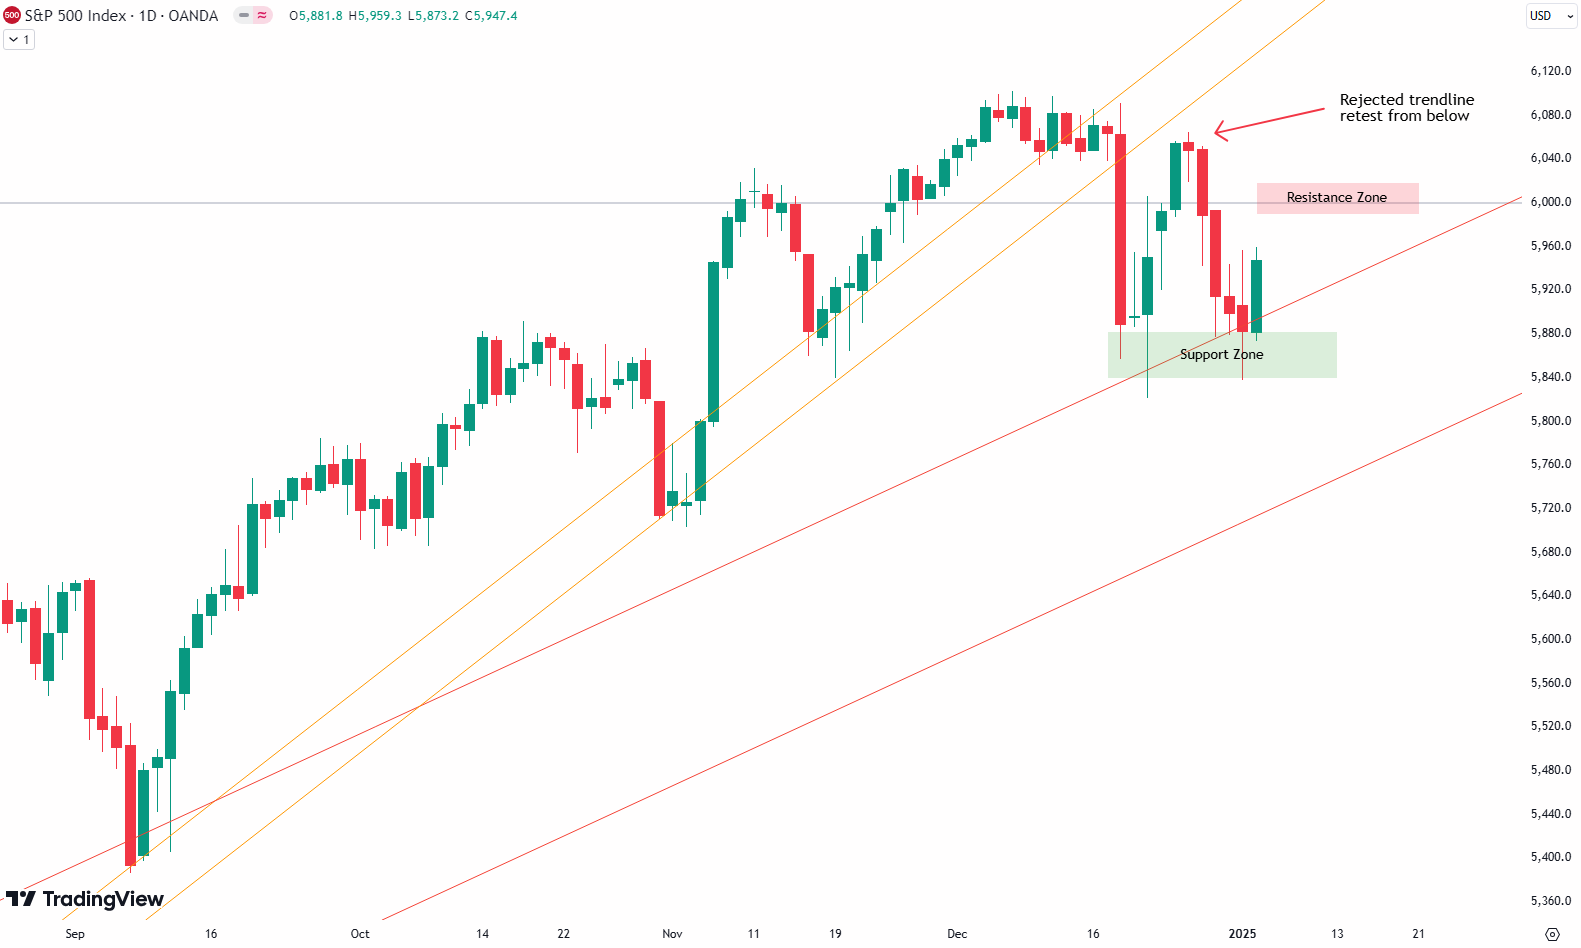
This week’s S&P 500 saw a minor decline of 0.7%. Losses persisted through the first half, with Monday through Wednesday marking gradual declines. However, Friday offered a promising recovery, as the index rose by 1.5%, closing just shy of critical levels. Reviewing the 4-hour chart, we observe the December 18th downturn initiating a corrective phase.…
-
Weekly Update S&P 500
Welcome to our weekly newsletter on the S&P 500. This week, the S&P 500 experienced a gain of 0.6%. When observing the four-hour chart, the last two weeks displayed notable volatility. Last week saw a sharp drop, whereas this week was less erratic, though the market still moved up and down. The result was a…
-

Weekly Update S&P 500
This week, the S&P 500 saw a loss of 1.6%. This week proved to be a challenging one for the S&P 500, marked by a significant drop on Wednesday. Previously, we highlighted the increasingly compressed price action within the rising wedge formation. On Wednesday, the index finally broke below this formation following the Federal Reserve’s…
-

Weekly Update S&P 500
This week, the S&P 500 closed with a loss of 0.7%. While this may not seem dramatic, it reflects a market grappling with mixed signals. Recent activity shows some underlying resilience but also signs of short-term weakness. As shown in the four-hour chart, the S&P 500 continues to test key levels. In November, the index…
-

Weekly Update S&P 500
Welcome to our weekly newsletter on the S&P 500. This week, the index posted a 0.8% gain, continuing its upward momentum. The S&P 500 had a strong start with steadily rising prices through the beginning and middle of the week. Only Thursday and Friday saw minor losses. As shown in the 4-hour chart, the trend…