Tag: #RiskManagement
-

Weekly Update S&P 500
Welcome to our weekly newsletter on the S&P 500. This week, the S&P 500 gained 1.1%. On the 4-hour chart, the market experienced ups and downs: volatility on Monday, gains on Tuesday, losses on Wednesday, and additional gains on Thursday and Friday. However, trading was light due to Thanksgiving week in the US. The 4-hour…
-
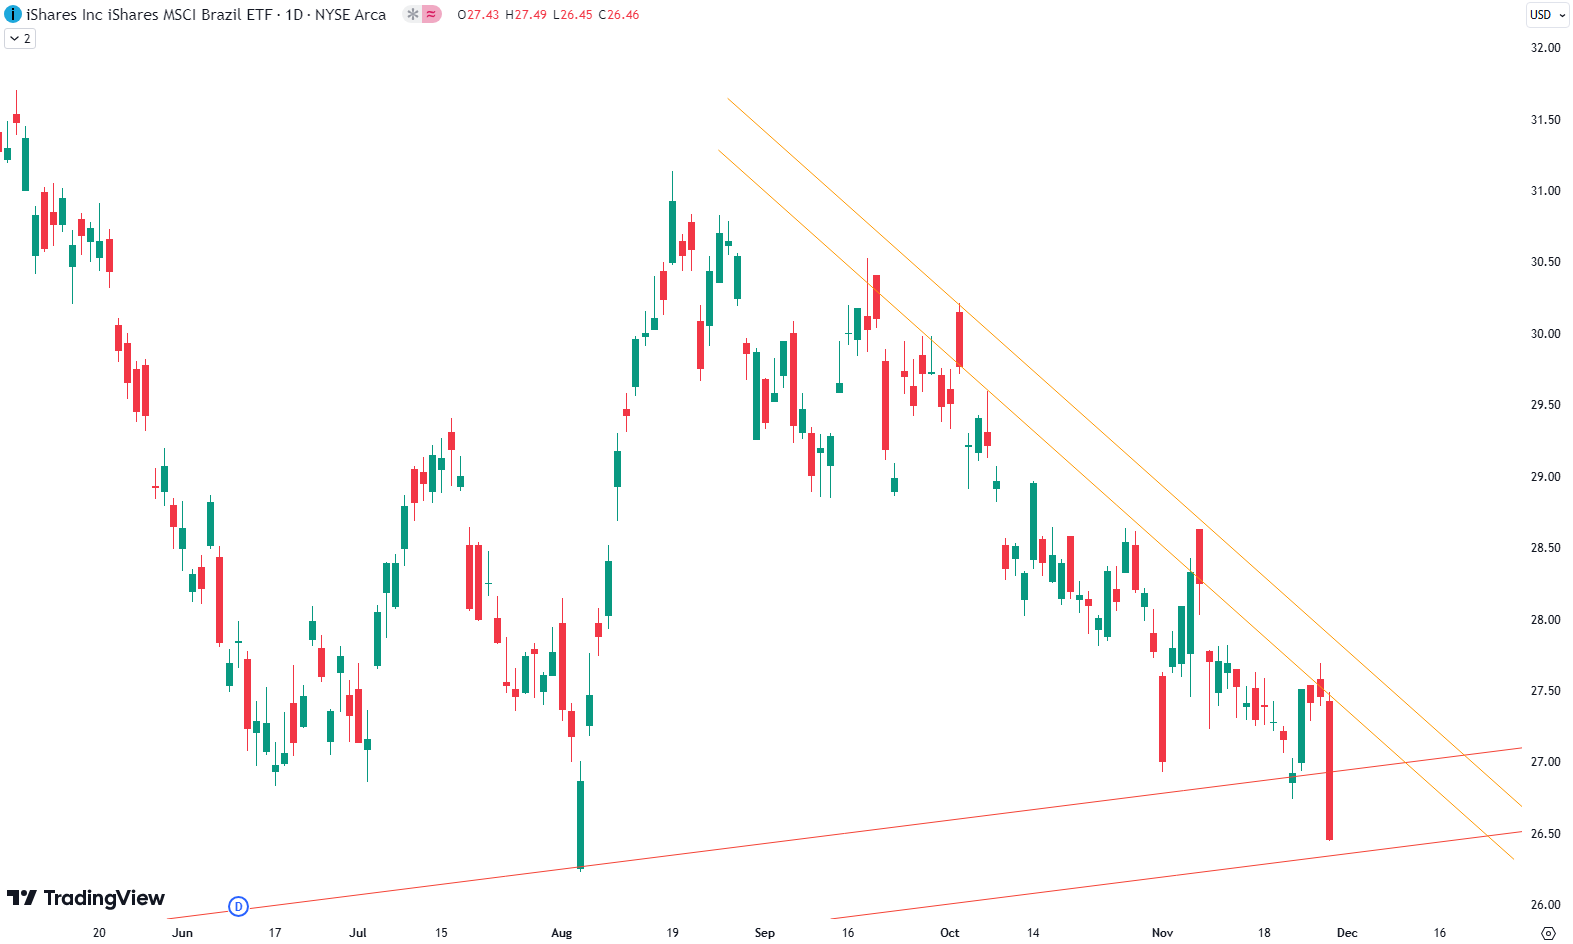
EWZ ETF: Brazil’s Stock Market at a Crossroads
This week, we’re diving into EWZ, the Brazilian ETF representing Brazil’s broader stock market. By analyzing its weekly and daily charts, we’ll uncover some intriguing patterns that may indicate a potential bounce. If you’re exploring global markets or ETFs, this is worth a closer look. Weekly Chart Analysis: A History of Support and Rebounds Looking…
-

Weekly Update S&P 500
Weekly Summary Welcome to our weekly newsletter on the S&P 500! This week, the index gained 1.6%, stabilizing after the previous week’s losses. Monday was uneventful, but Tuesday saw a sharp selloff followed by a swift recovery. Wednesday featured a back-and-forth movement, while Thursday and Friday delivered steady gains to close out the week. On…
-

Bitcoin Rally: What Long-Term Trend Lines Reveal About the Next Move
Bitcoin has been on a tear recently, gaining an impressive 45% since the beginning of November. For those new to cryptocurrency investing, this explosive move may seem sudden, but the charts tell a fascinating story of persistence, resistance, and eventual breakout. Tracking Bitcoin’s Journey: A Look at the Daily Chart The daily Bitcoin chart reveals…
-

Understanding Bonds Made Simple
What Are Bonds?Bonds are an essential but often overlooked investment option. At their core, bonds are loans that you, the investor, provide to a borrower—usually a corporation (corporate bonds) or a government (government bonds). In return, the borrower agrees to pay you interest for a set period, at the end of which you get your…
-

Weekly Update S&P 500
A Pullback After Overbought Levels Welcome to our weekly newsletter on the S&P 500! This week, the index experienced a -2.0% decline, following a strong post-election rally. Last week, we noted the S&P 500’s overbought condition as it approached a long-standing resistance trendline on the weekly chart (marked in red). From Monday onward, the index…
-
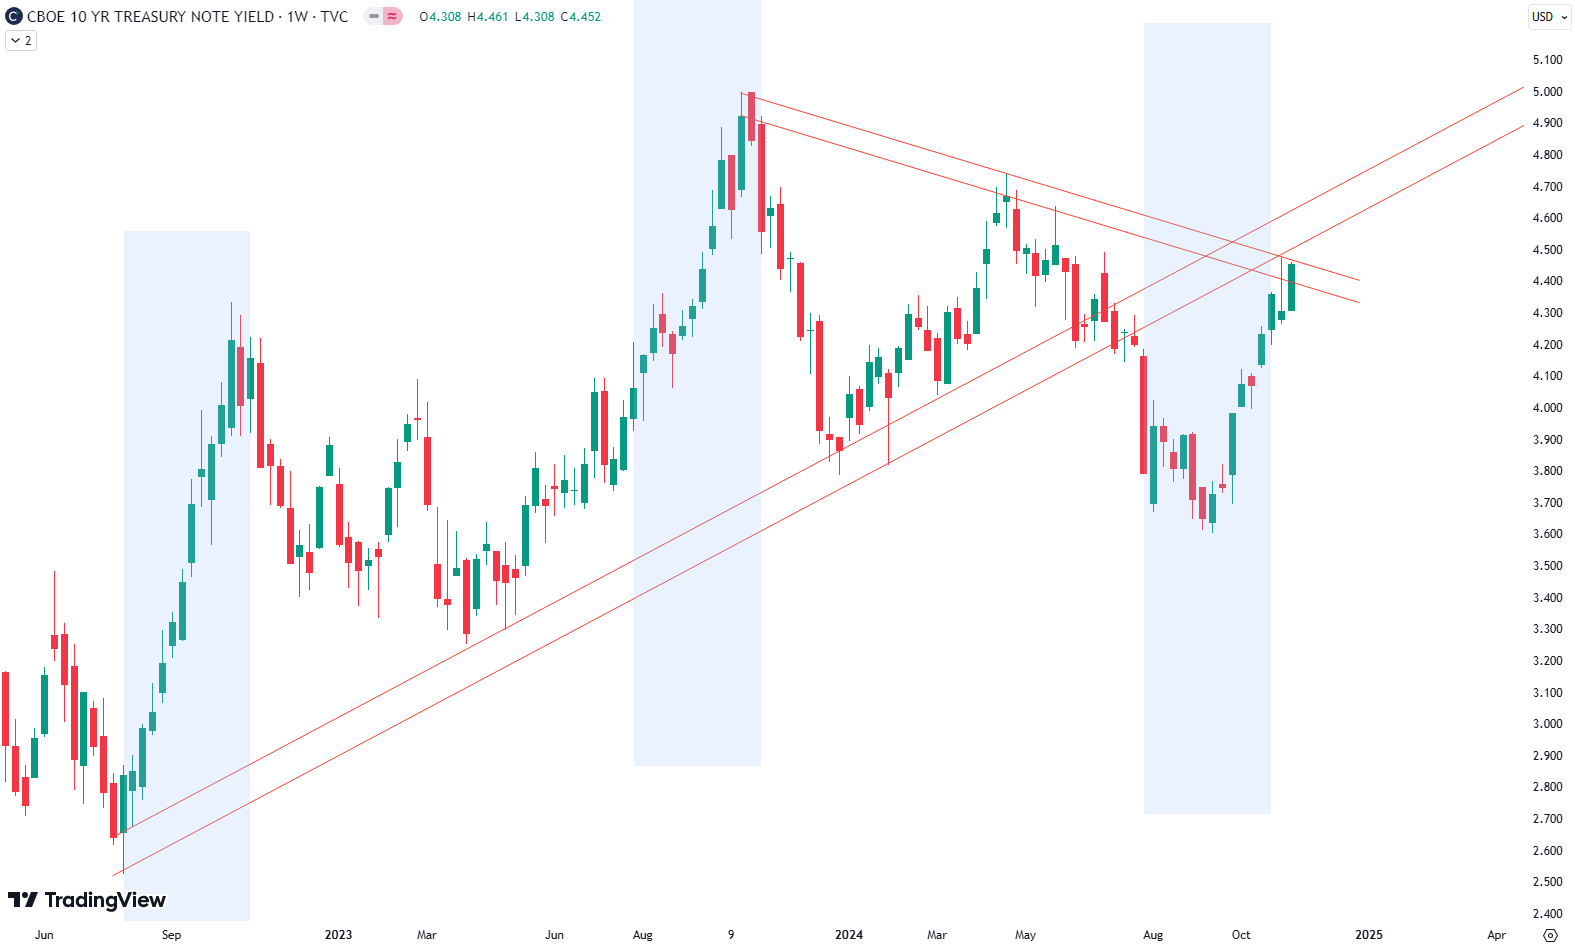
A Follow-Up on Bonds
Yield Watch: How Technical Indicators Are Shaping the 10-Year Treasury Yield This week, we’re taking a closer look at the technical indicators driving the US 10-year Treasury yield. Following last week’s article on the yield’s seasonal pattern, which typically peaks from August to October, we’re now focusing on key trendlines that are creating a strong…
-

Weekly Update S&P 500
Weekly Overview: S&P 500 Gains 4.6% on Election Momentum Welcome to this week’s update on the S&P 500! This past week, the S&P 500 recorded a significant 4.6% gain, driven by strong election-related momentum. Leading up to the election results, we noticed the index hovering near a critical support level, as indicated by the orange…
-

Is it Bond-Buying Season?
Exploring the 10-Year U.S. Treasury Yield: Seasonal Patterns and Investment Insights The 10-year U.S. Treasury yield follows a notable seasonal pattern, typically rising in August, September, and October each year since 2016. During these months, the yield has usually increased by 22–40 basis points, although certain years, such as 2022 and 2023, saw surges of…
-

Weekly Update S&P 500
Welcome to our weekly newsletter covering the latest on the S&P 500. This past week, the index had a loss of 1.3%, continuing a sluggish pattern seen over the past couple of weeks. A Sluggish Start with a Steep Mid-Week Decline Early in the week, the S&P 500 maintained its sluggish, sideways movement, mirroring trends…