Tag: #RiskManagement
-

T-Mobile: A 15-Year Trendline Analysis
This week, we’re diving into T-Mobile’s stock with an interesting chart that dates back to 2009. This chart uses a logarithmic scale, showcasing a clear and steady trend channel defined by three parallel trendlines: the green line at the bottom, the grey line in the middle, and the red line at the top. Each line…
-
Weekly Update S&P 500
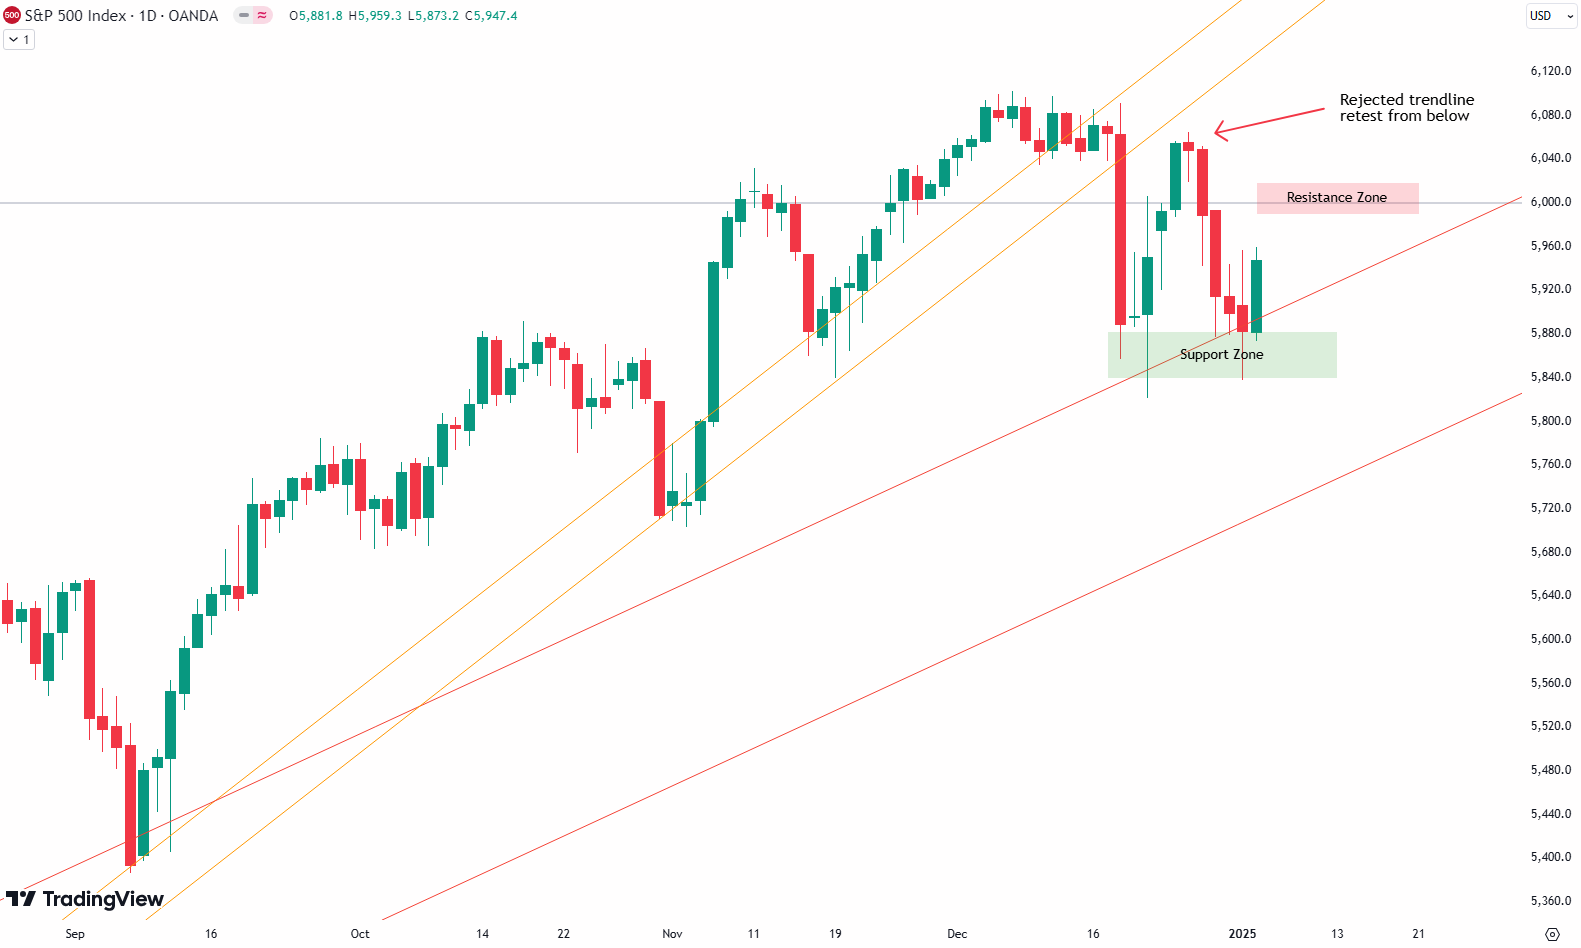
This week’s S&P 500 saw a minor decline of 0.7%. Losses persisted through the first half, with Monday through Wednesday marking gradual declines. However, Friday offered a promising recovery, as the index rose by 1.5%, closing just shy of critical levels. Reviewing the 4-hour chart, we observe the December 18th downturn initiating a corrective phase.…
-

Meta’s Weekly Chart Analysis
Since hitting a low in October 2022, Meta’s stock has seen an extraordinary rise of 500%, outpacing many of its peers in the tech sector. This dramatic rebound underscores Meta’s resilience as the company continues to recover from challenges it faced in the preceding years. Examining the weekly chart, we observe three key parallel trendlines—green,…
-
Weekly Update S&P 500
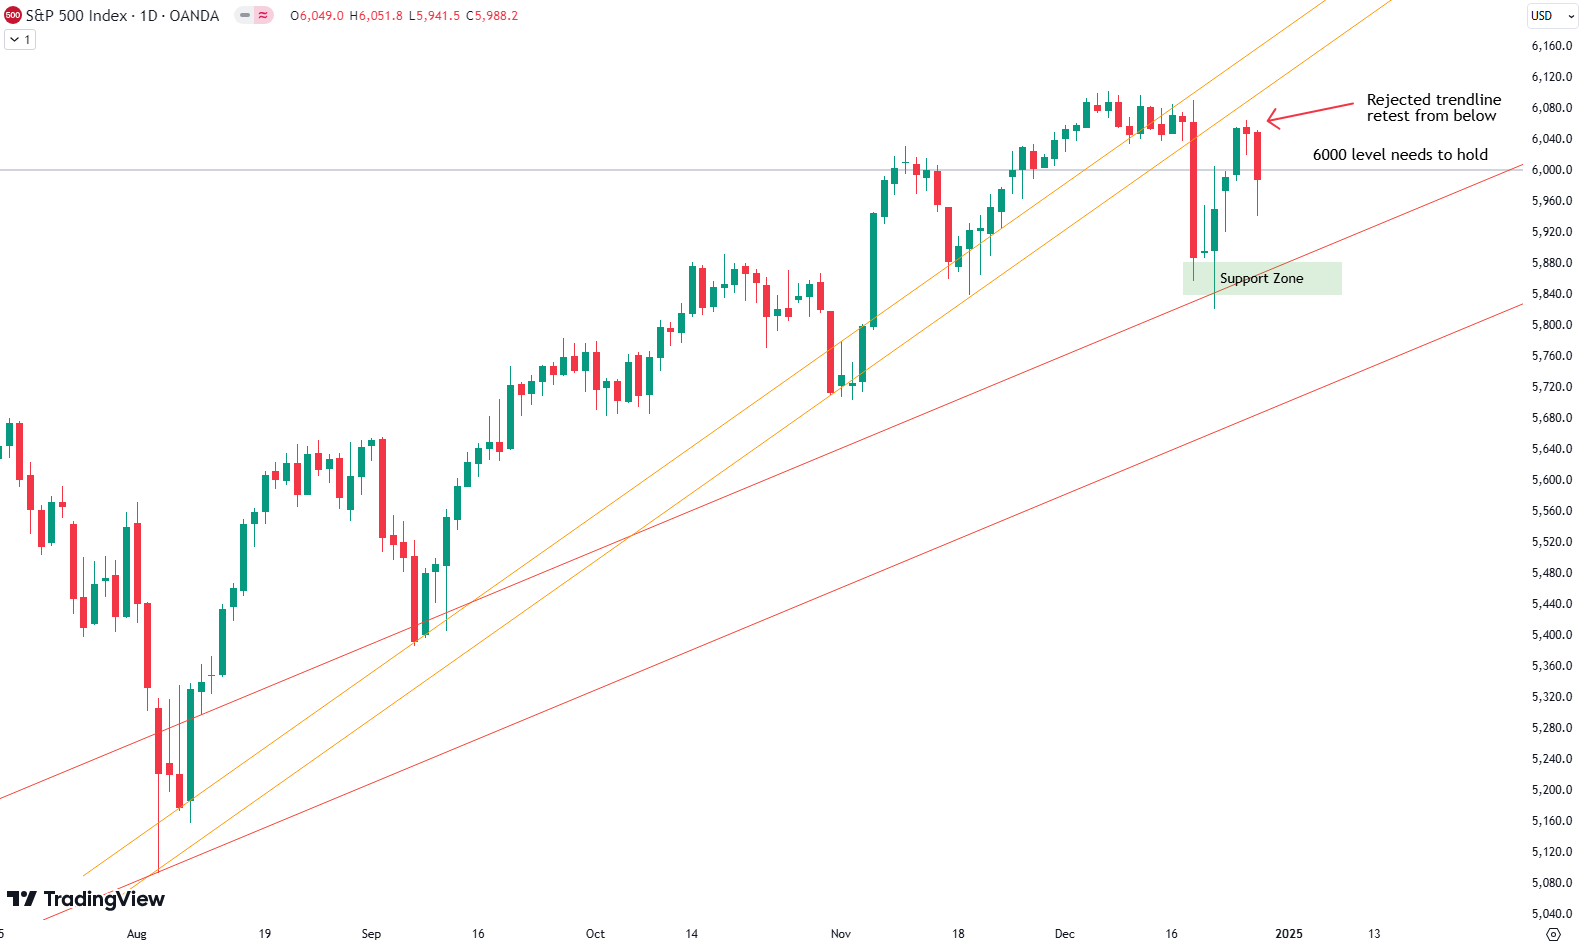
Welcome to our weekly newsletter on the S&P 500. This week, the S&P 500 experienced a gain of 0.6%. When observing the four-hour chart, the last two weeks displayed notable volatility. Last week saw a sharp drop, whereas this week was less erratic, though the market still moved up and down. The result was a…
-

Analyzing 100 Years of the S&P 500: A Technical Perspective
When it comes to understanding the S&P 500 on a long-term scale, there’s nothing quite like zooming out. By looking at a yearly chart, where each candle represents one year of market movement, we gain valuable perspective. Spanning more than 100 years, this approach offers clarity about where we stand today while letting us analyze…
-

Weekly Update S&P 500
This week, the S&P 500 saw a loss of 1.6%. This week proved to be a challenging one for the S&P 500, marked by a significant drop on Wednesday. Previously, we highlighted the increasingly compressed price action within the rising wedge formation. On Wednesday, the index finally broke below this formation following the Federal Reserve’s…
-

Weekly Update S&P 500
This week, the S&P 500 closed with a loss of 0.7%. While this may not seem dramatic, it reflects a market grappling with mixed signals. Recent activity shows some underlying resilience but also signs of short-term weakness. As shown in the four-hour chart, the S&P 500 continues to test key levels. In November, the index…
-

Critical Support Zone for Microsoft
Microsoft has been underperforming the broader market, including the S&P 500, since July. The trouble began with a sharp 17% drop in July—a steep and impulsive move downward that set the stage for the months that followed. Since then, Microsoft has risen again, but the upward movement has been slow and marked by overlapping wave…
-

Weekly Update S&P 500
Welcome to our weekly newsletter on the S&P 500. This week, the index posted a 0.8% gain, continuing its upward momentum. The S&P 500 had a strong start with steadily rising prices through the beginning and middle of the week. Only Thursday and Friday saw minor losses. As shown in the 4-hour chart, the trend…
-

Political Instability Reflected in French Bond Yields
When it comes to government bonds, the yield can tell us a lot—not just about returns but also about the perceived stability of the issuing government. Today, let’s look at the yield spread between 10-year French and German bonds and what it reveals. What are bond yields? A bond yield is the return an investor…