Tag: #MarketAnalysis
-

Weekly Update S&P 500
A Pullback After Overbought Levels Welcome to our weekly newsletter on the S&P 500! This week, the index experienced a -2.0% decline, following a strong post-election rally. Last week, we noted the S&P 500’s overbought condition as it approached a long-standing resistance trendline on the weekly chart (marked in red). From Monday onward, the index…
-

Weekly Update S&P 500
Weekly Overview: S&P 500 Gains 4.6% on Election Momentum Welcome to this week’s update on the S&P 500! This past week, the S&P 500 recorded a significant 4.6% gain, driven by strong election-related momentum. Leading up to the election results, we noticed the index hovering near a critical support level, as indicated by the orange…
-

Weekly Update S&P 500
Welcome to our weekly newsletter covering the latest on the S&P 500. This past week, the index had a loss of 1.3%, continuing a sluggish pattern seen over the past couple of weeks. A Sluggish Start with a Steep Mid-Week Decline Early in the week, the S&P 500 maintained its sluggish, sideways movement, mirroring trends…
-

Weekly Update S&P 500
Welcome to our weekly S&P 500 newsletter. This week, the S&P 500 experienced a 1.0% gain despite a highly volatile trading pattern. After last week’s signals of an overbought market, a pullback seemed likely, and indeed, the index saw significant shifts throughout the week. From Monday through Wednesday, the S&P 500 experienced a steady decline,…
-

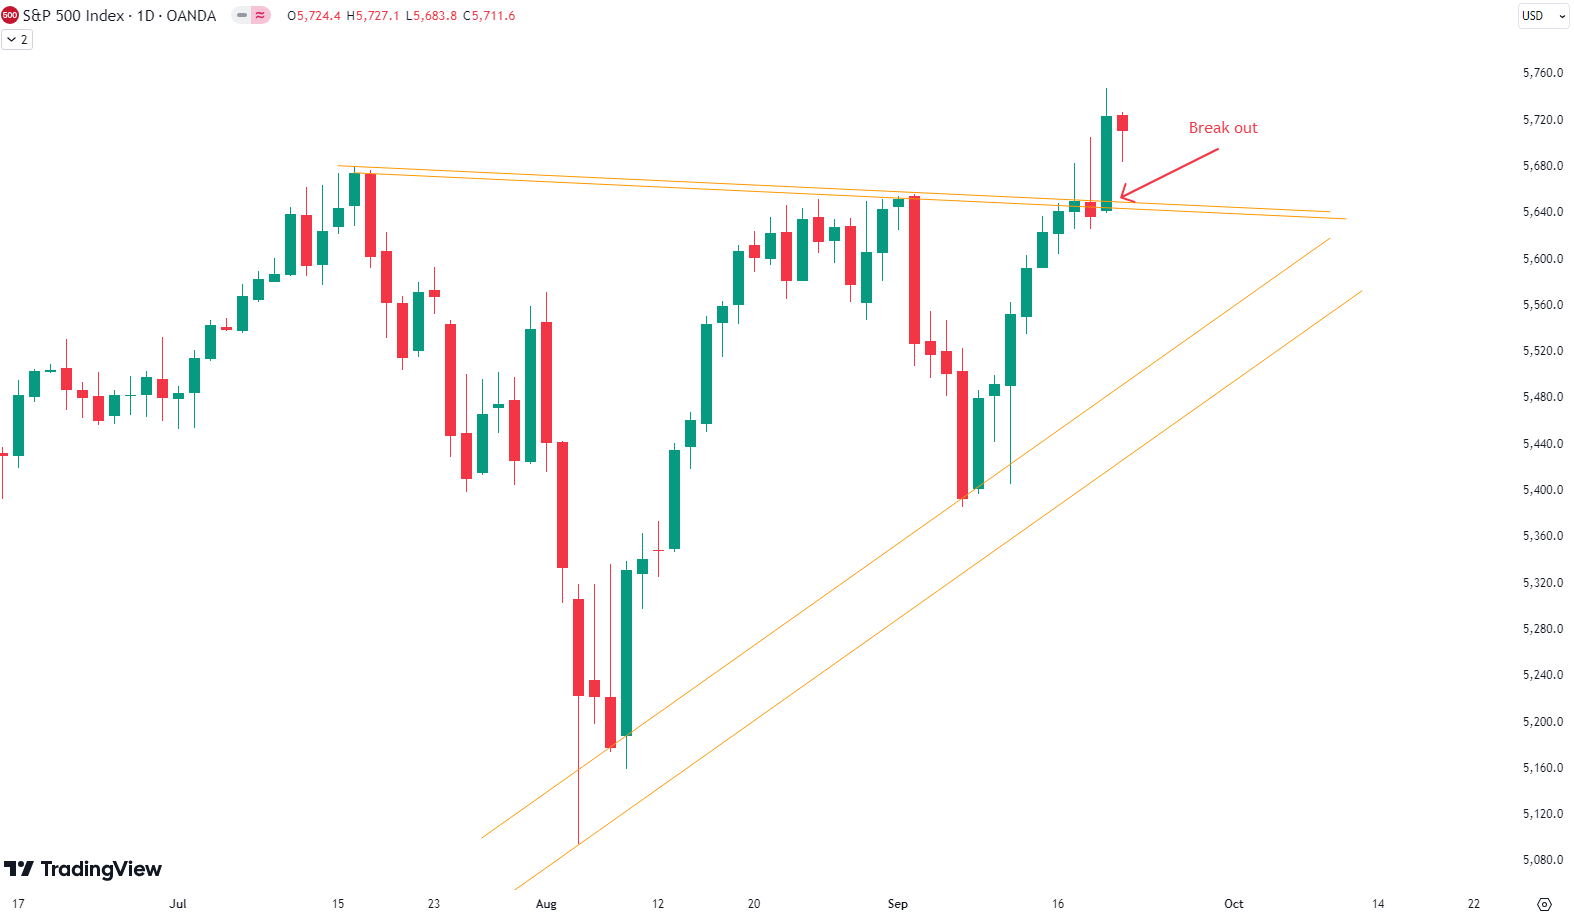
Weekly Update S&P 500
Welcome to our weekly newsletter on the S&P 500. This week, the S&P 500 experienced a 0.8% gain, reflecting a relatively volatile trading period. After breaking out of the wedge formation discussed in last week’s update, the index saw significant movement. The S&P 500 enjoyed a strong rise on Monday, followed by a sell-off on…
-
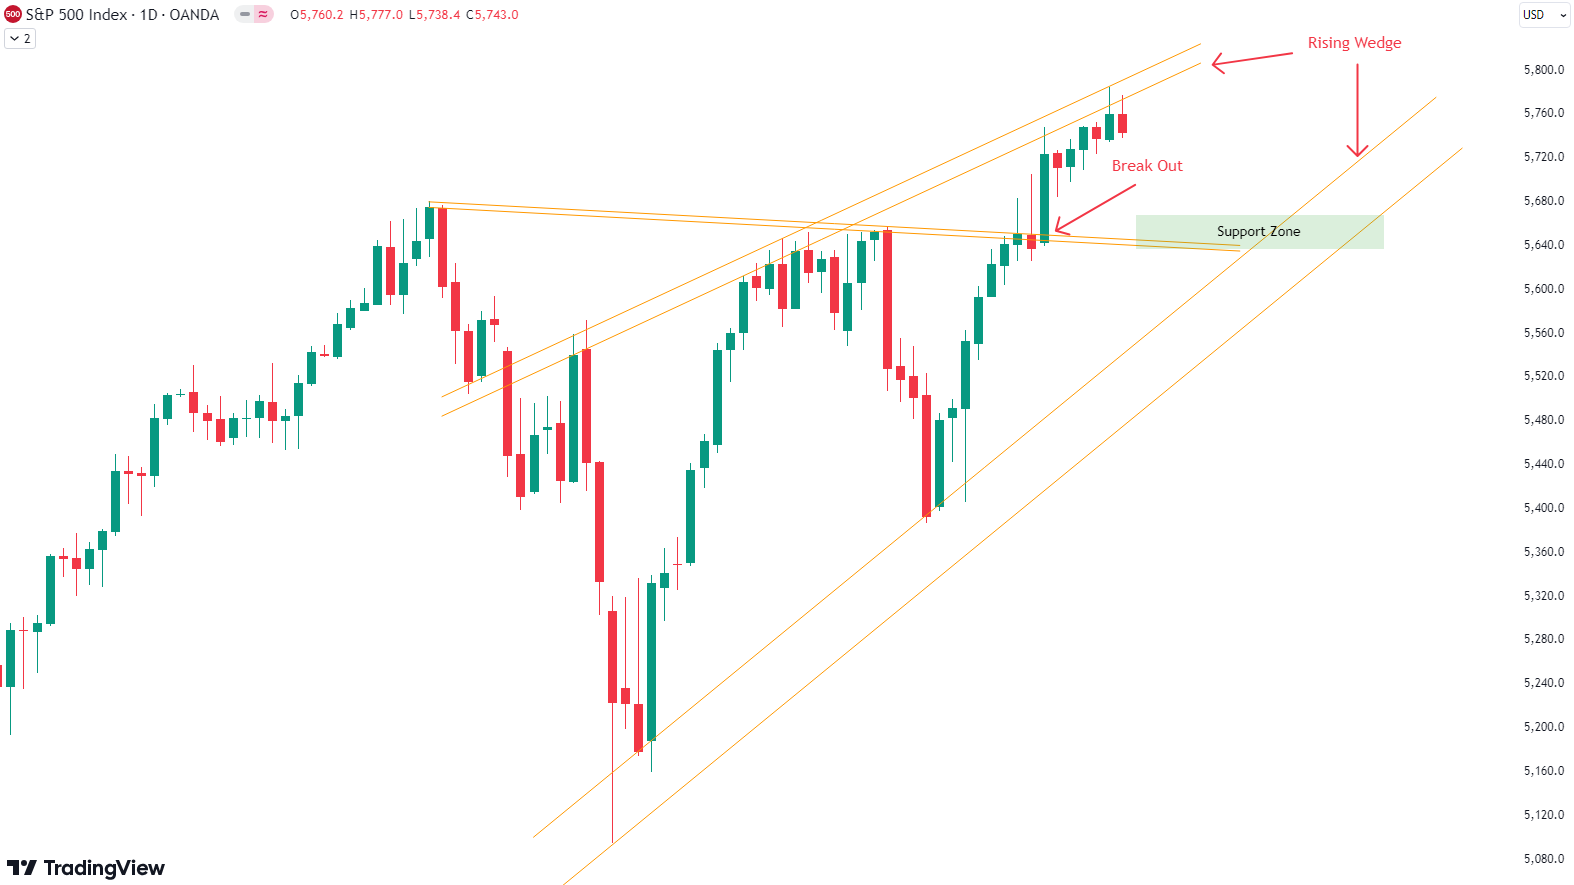
Weekly Update S&P 500
Welcome to our weekly newsletter on the S&P 500! This week, the S&P 500 saw a solid gain of 1.1%, reflecting strong momentum in the market. Looking at the 4-hour chart, the index has been forming a wedge pattern since early October. This pattern, shown by the green trend lines, indicates some corrective sideways action.…
-
Weekly Update S&P 500
This week, the S&P 500 experienced a modest 0.2% gain. As you can see from the chart, the market followed a slow-moving path, showing limited action. Last week’s newsletter mentioned the gray trend line on the one-hour chart, and on Friday, the S&P 500 broke below that line. On Monday and Tuesday, the index failed…
-
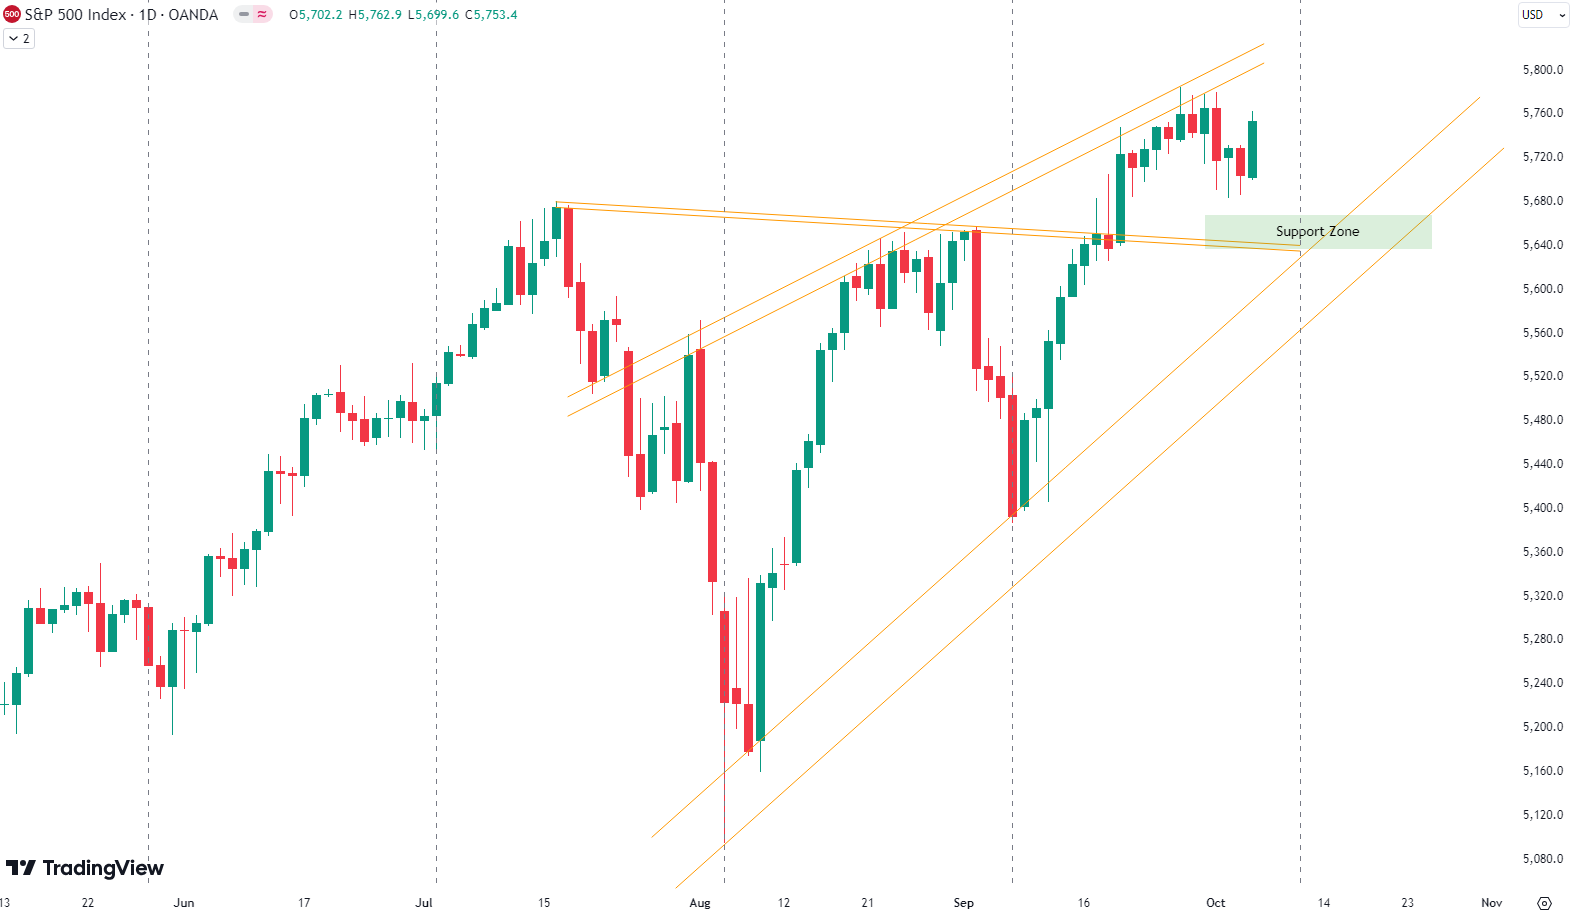
Weekly Update S&P 500
Welcome to our weekly newsletter on the S&P 500! This week, the S&P 500 recorded a modest gain of 0.5%, climbing steadily each day. While the upward movement was gradual, it was consistent. If you look at the one-hour chart, you’ll see the price forming a clear upward-sloping trendline (grey on the chart). The price…
-
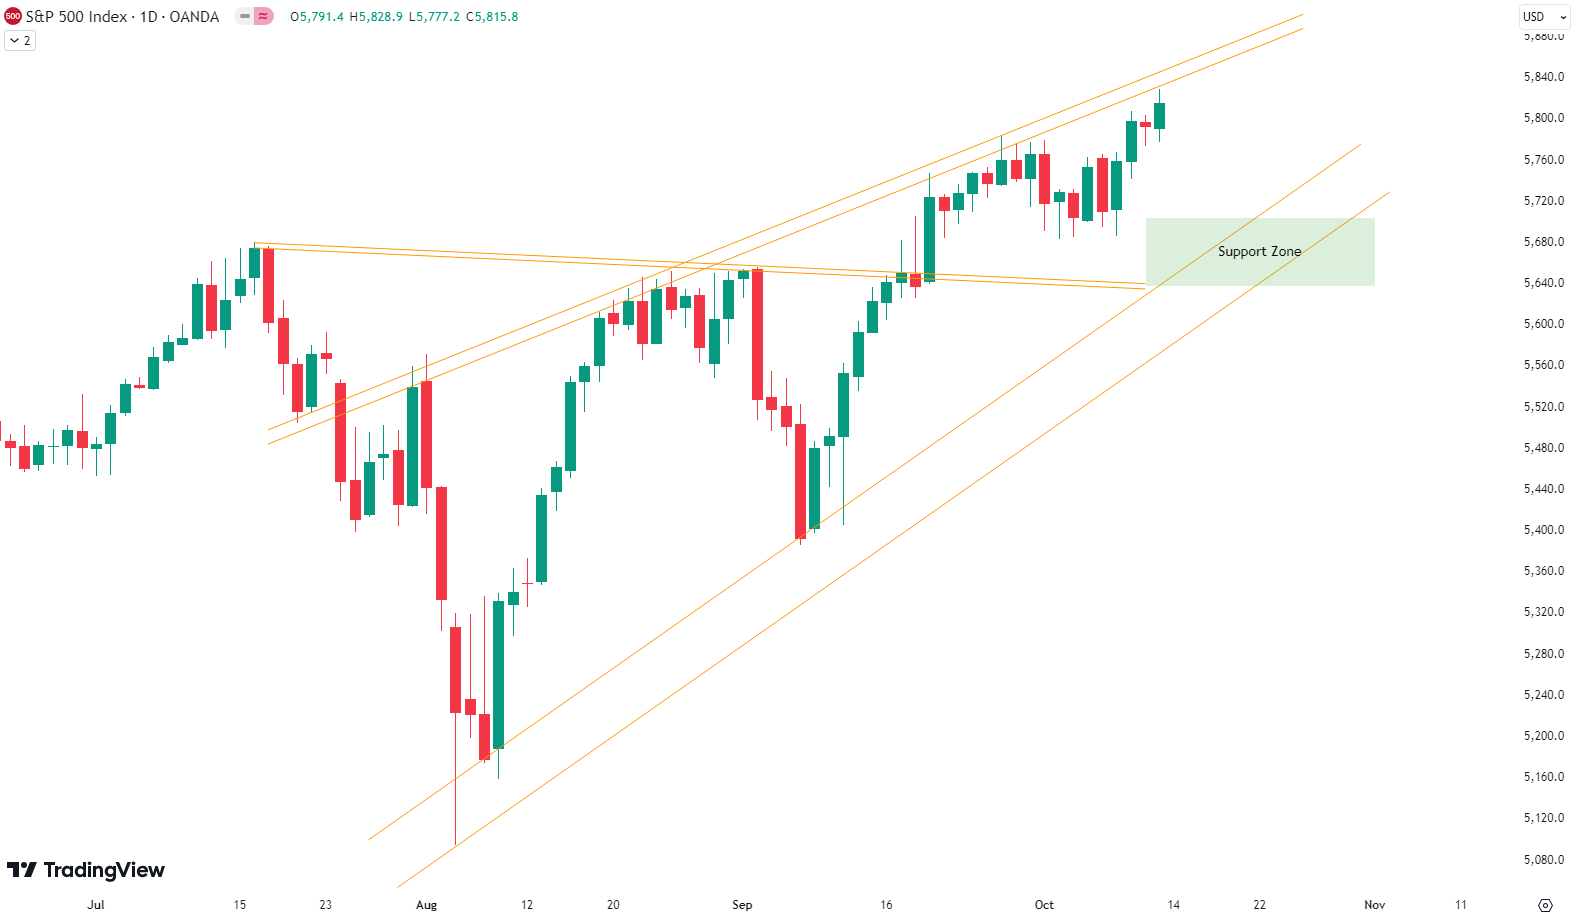
Weekly Update S&P 500
Welcome to our weekly update on the S&P 500! This week, the S&P 500 gained 1.6%, continuing its positive momentum. The first half of the week saw relatively little movement, as traders waited for the big Federal Reserve meeting on Wednesday. As the market expected, the Fed cut rates by 0.5%, which initially triggered a…
-
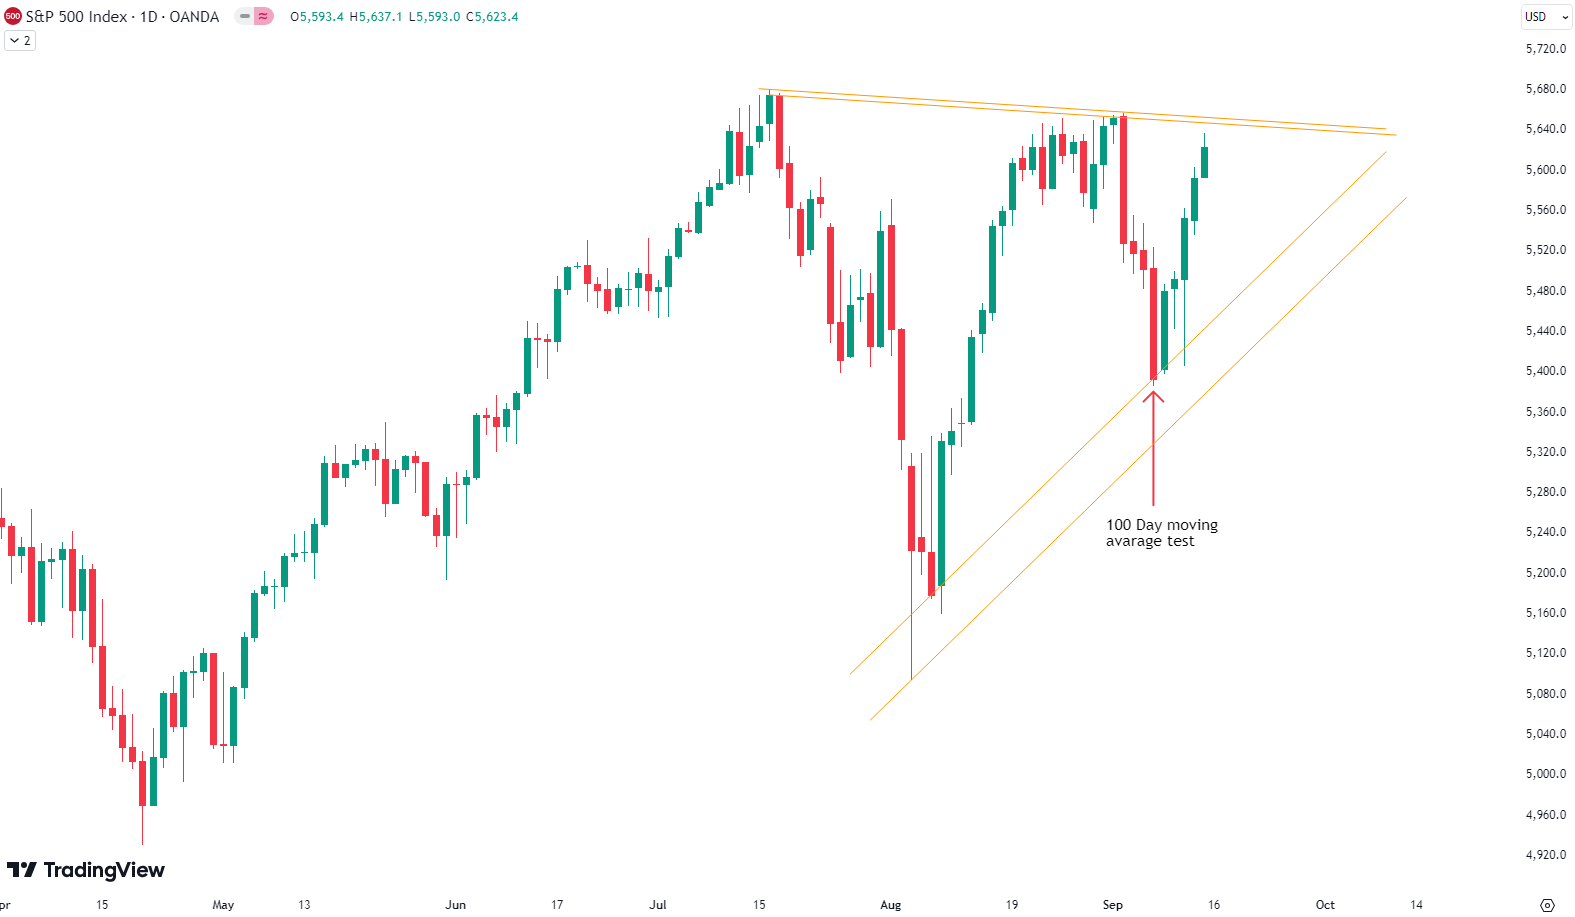
Weekly Update S&P 500
This week was particularly strong for the S&P 500, which gained 4.3%. The market saw minor increases on Monday, followed by a flat Tuesday. However, Wednesday was a rollercoaster of volatility, with a sharp drop of 1.7% within two hours before rallying with an impressive 2.9% rise into the close. Thursday and Friday continued to…