Tag: #MarketAnalysis
-
Weekly Update S&P 500
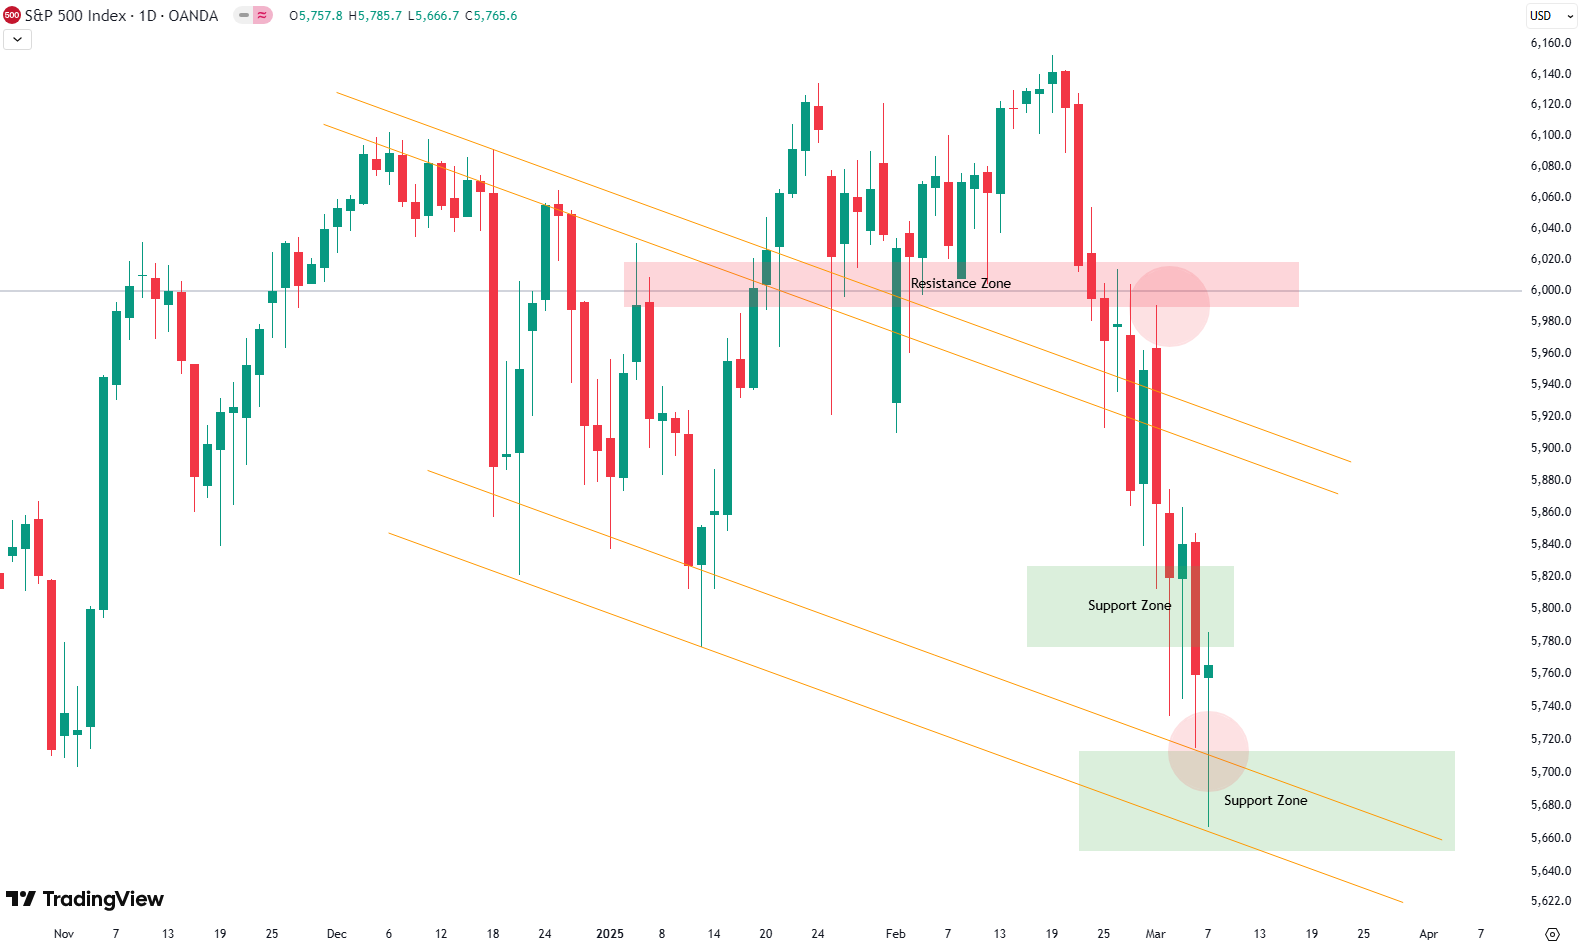
Welcome to our weekly newsletter on the S&P 500! This week, the S&P 500 lost 3.1%, marking another tough week for the market. Looking at the 4-hour chart, we can see how the 6,000-point level—which used to be strong support—has now turned into a resistance zone. As expected, the market saw a bounce on Monday,…
-
Weekly Update S&P 500
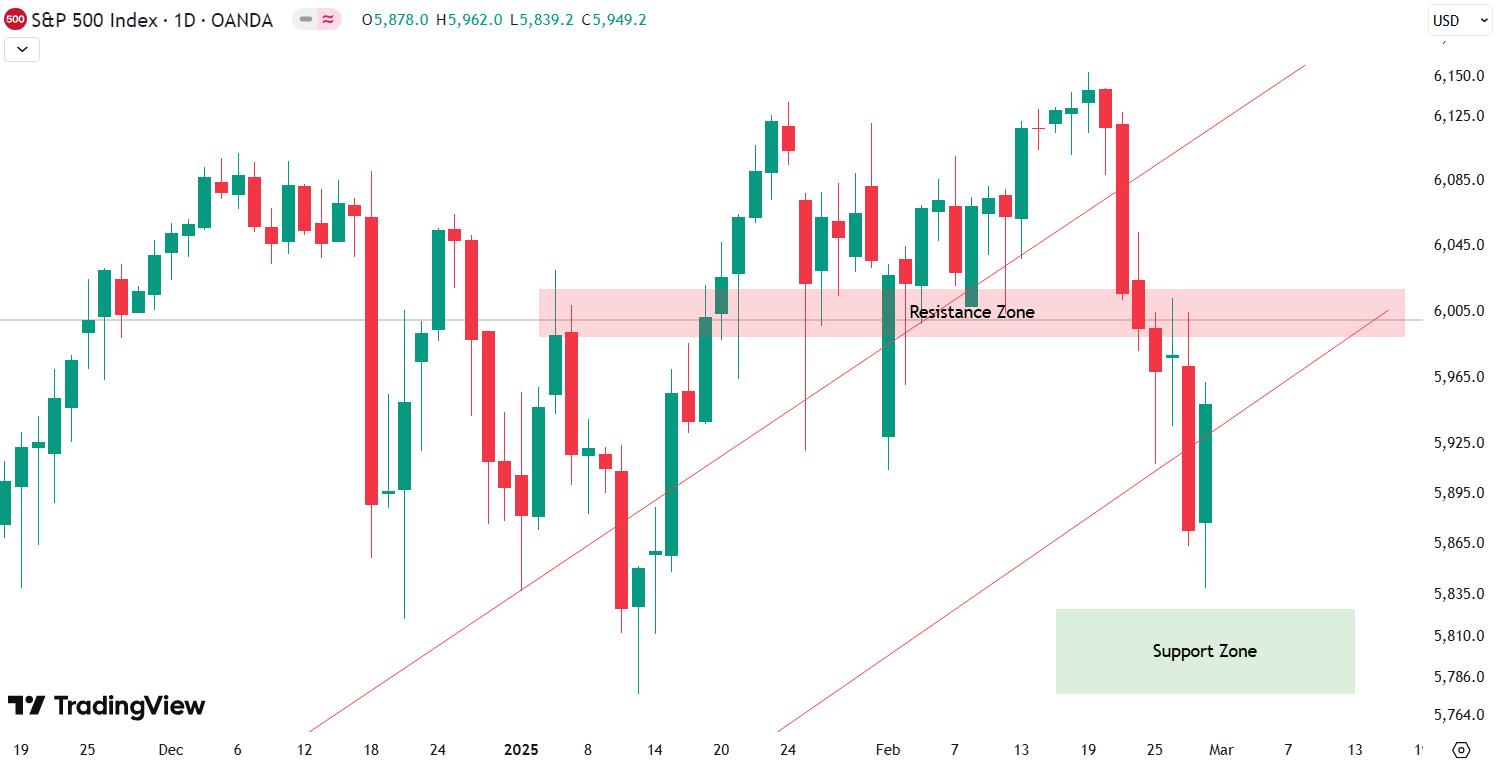
This week, the S&P 500 had a loss of 1.1%. The S&P 500 saw a sharp decline this week. Last week, we pointed out that the index had closed below the green trendline on the chart. At that time, we were still holding above the key 6,000-point support zone. However, this week, sellers took control,…
-
Weekly Update S&P 500
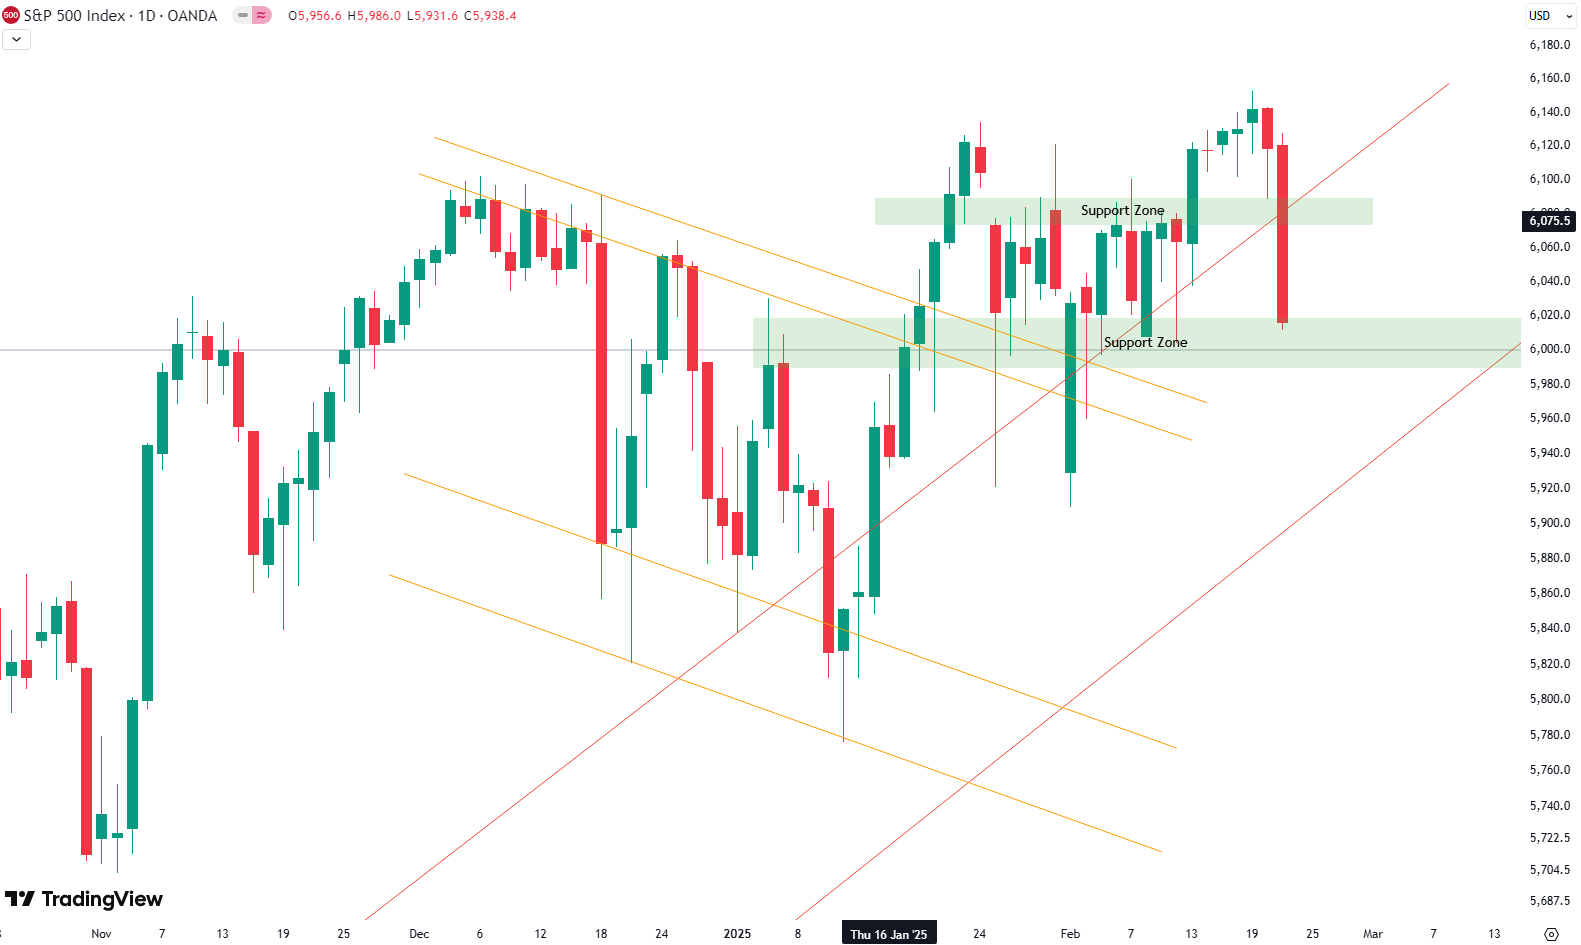
This week, the S&P 500 had another rollercoaster ride, ending with a 1.7% loss. Looking at the 4-hour chart, the market remained relatively stable for most of the week, moving sideways before a small drop on Thursday, a brief recovery, and a sharp sell-off on Friday. As seen in the chart, the green support zone…
-
Weekly Update S&P 500
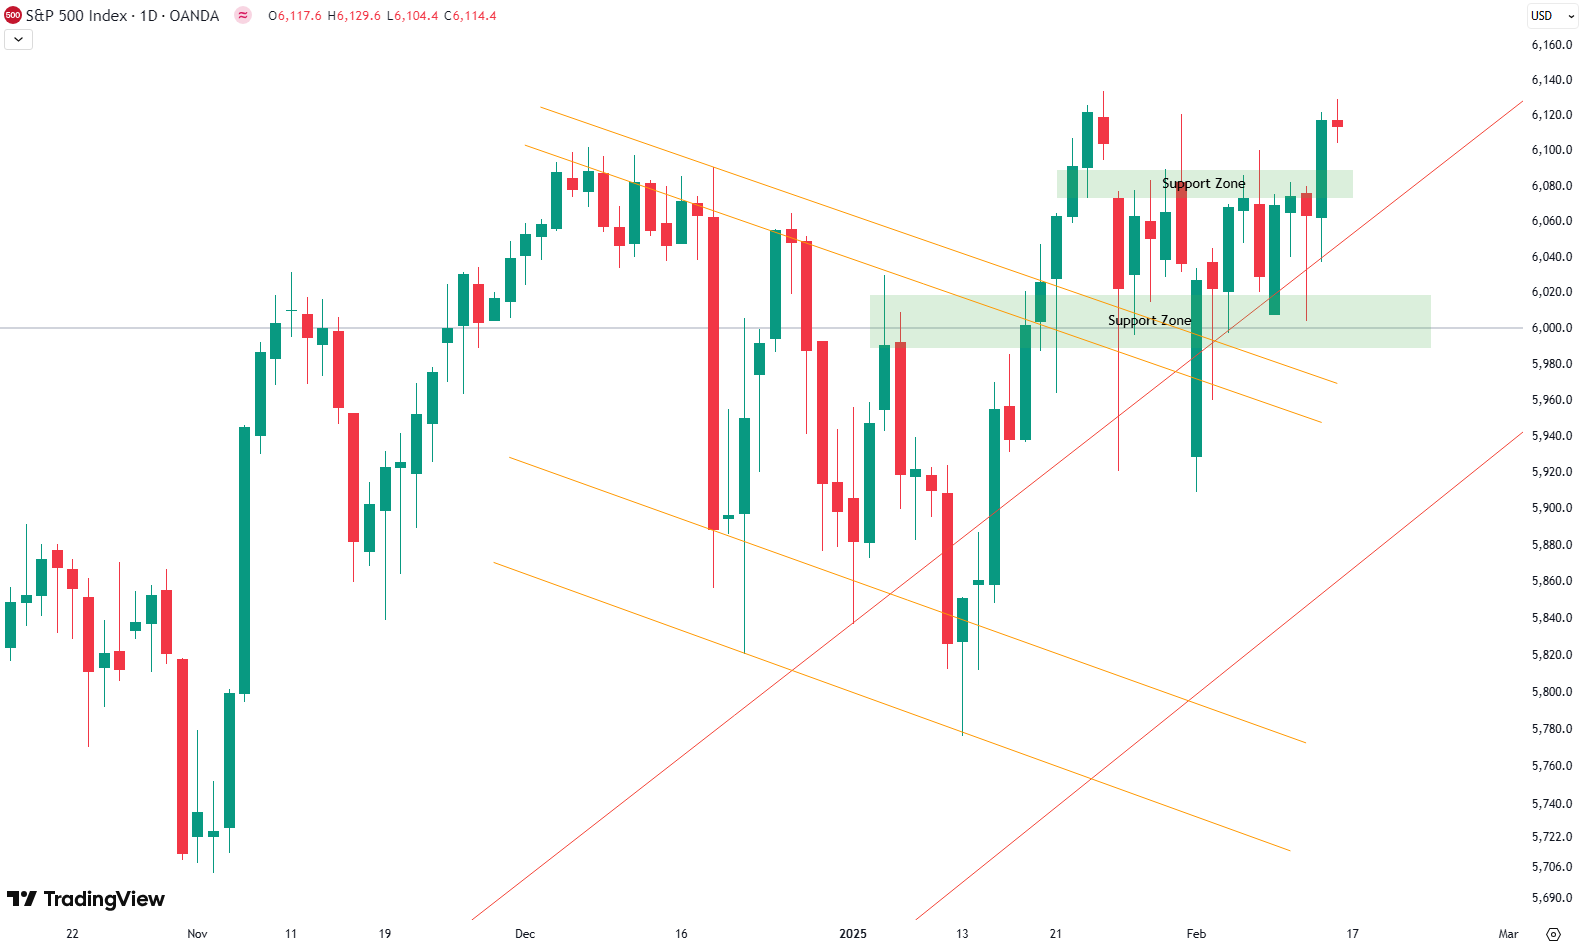
This week, the S&P 500 gained 1.5%, showing strength after weeks of consolidation. As seen in the chart, the 4-hour timeframe highlights increased volatility, with price swings in both directions. Instead of a clear correction to the downside, the market has been moving sideways, building a base around the 6,000-point mark, which has repeatedly acted…
-

Weekly Update S&P 500
Hello everyone! This week was another eventful one for the S&P 500. Looking at the 4-hour chart, we can see some major market movements. The week kicked off with a sharp drop of 1.8% at the open on Monday, meaning the market opened significantly lower than Friday’s close. However, what happened next was impressive: the…
-

Weekly Update S&P 500
Welcome to our weekly newsletter on the S&P 500. This week, the S&P 500 posted a loss of 1.1%. As shown in the 4‑hour chart covering the last couple of weeks, we saw a strong upward trend that suddenly met some turbulence. Over the weekend, new information emerged about China’s AI DeepSeek—a model that promises…
-

Weekly Update S&P 500
The S&P 500 had an impressive week, gaining 1.5% as it maintained its recent bullish momentum. Examining the 4-hour chart (with each candle representing 4 hours), we saw significant action unfold. After some volatility early in the week, the index finished on a strong note heading into Friday. The last two weeks have been especially…
-

Weekly Update S&P 500
Welcome to this week’s S&P 500 newsletter! The week kicked off with strength, delivering some much-needed optimism after a rough prior week. While the S&P 500 ended the previous week with a 2.0% decline, we saw a strong recovery of 3.0% this week. Monday’s rally set the tone, and the momentum carried into Wednesday. For…
-

Weekly Update S&P 500
Welcome to our weekly S&P 500 analysis. This week, the market saw a significant decline, with the index losing 2%. Last week, we anticipated another test of the key 6,000-point psychological level, and that’s precisely what happened earlier this week. The S&P 500 attempted to break above this barrier on Monday and Tuesday, only to…
-
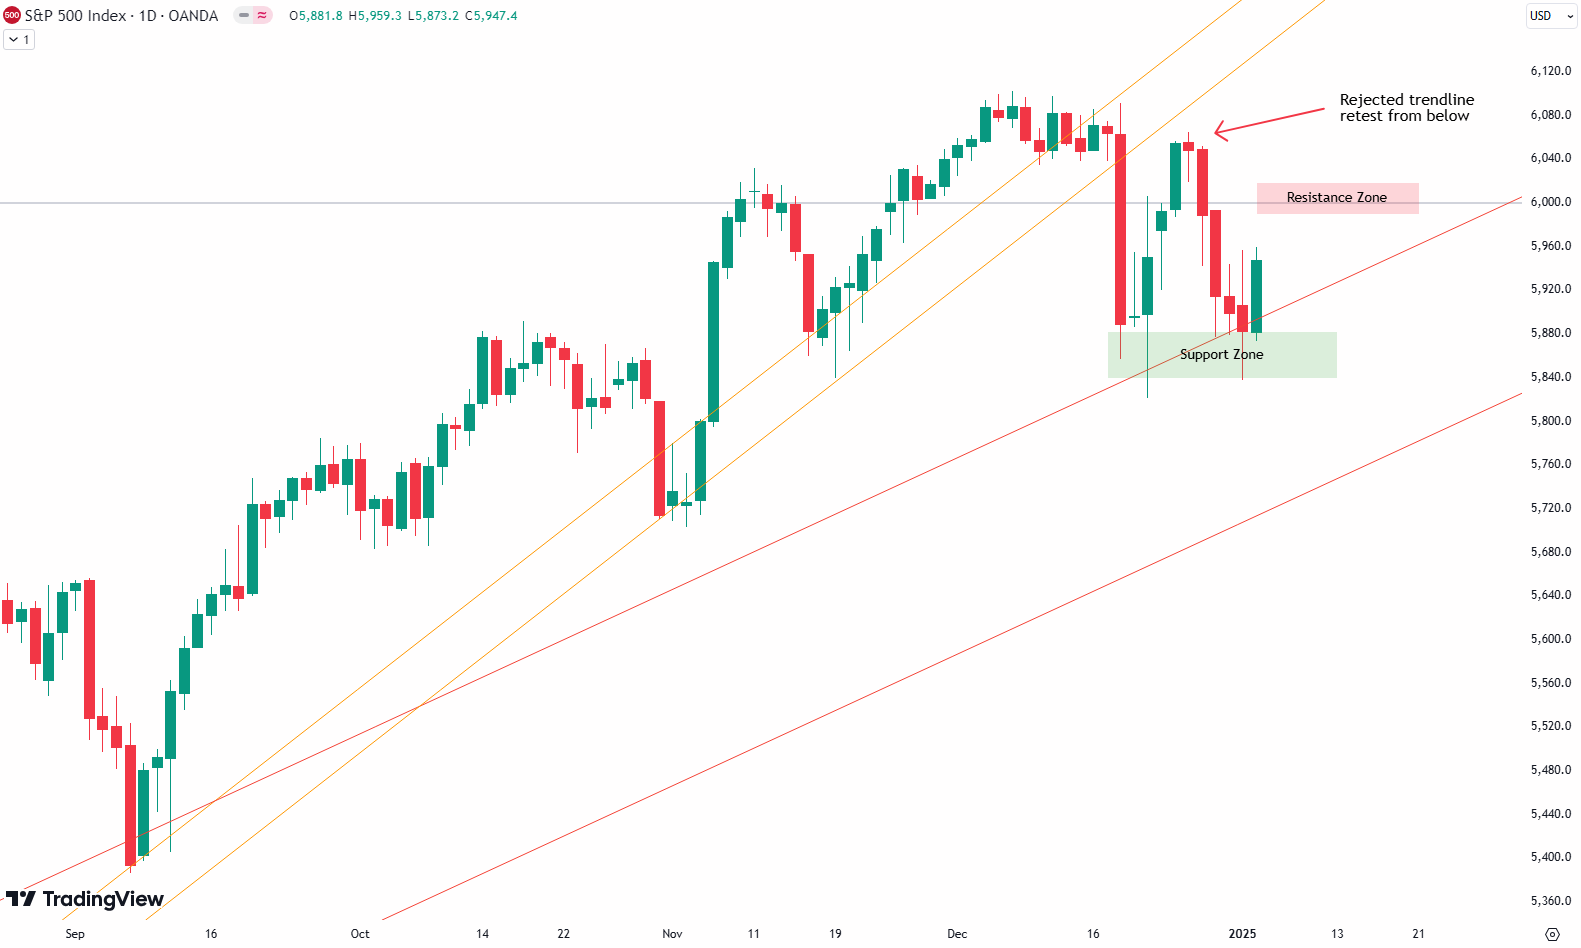
Weekly Update S&P 500
This week’s S&P 500 saw a minor decline of 0.7%. Losses persisted through the first half, with Monday through Wednesday marking gradual declines. However, Friday offered a promising recovery, as the index rose by 1.5%, closing just shy of critical levels. Reviewing the 4-hour chart, we observe the December 18th downturn initiating a corrective phase.…