Tag: #Investing
-

S&P 500 Weekly Analysis: 6% Surge & 7800 Resistance
Week 32, 2026 | 3.6% | 6.3% since last week’s low Daily TechnicalsLevels marked in red on the chart.The 7800 mark stands as the key overhead resistance level that must be broken to unlock further gains. Short Term Risk Bottom: Buy score in green, sell score in red, S&P 500 in black. Top right: Zoomed in…
-

ETF Technical Analysis Strategy: When to Buy & Trim
Welcome to our ETF update. We provide an overview of different ETFs across various asset classes and base our analysis on technicals. We list some ETFs that, from a risk/reward perspective, currently look like good buy opportunities, and others that are better suited as sell or take-profit options right now. Want to know the best…
-
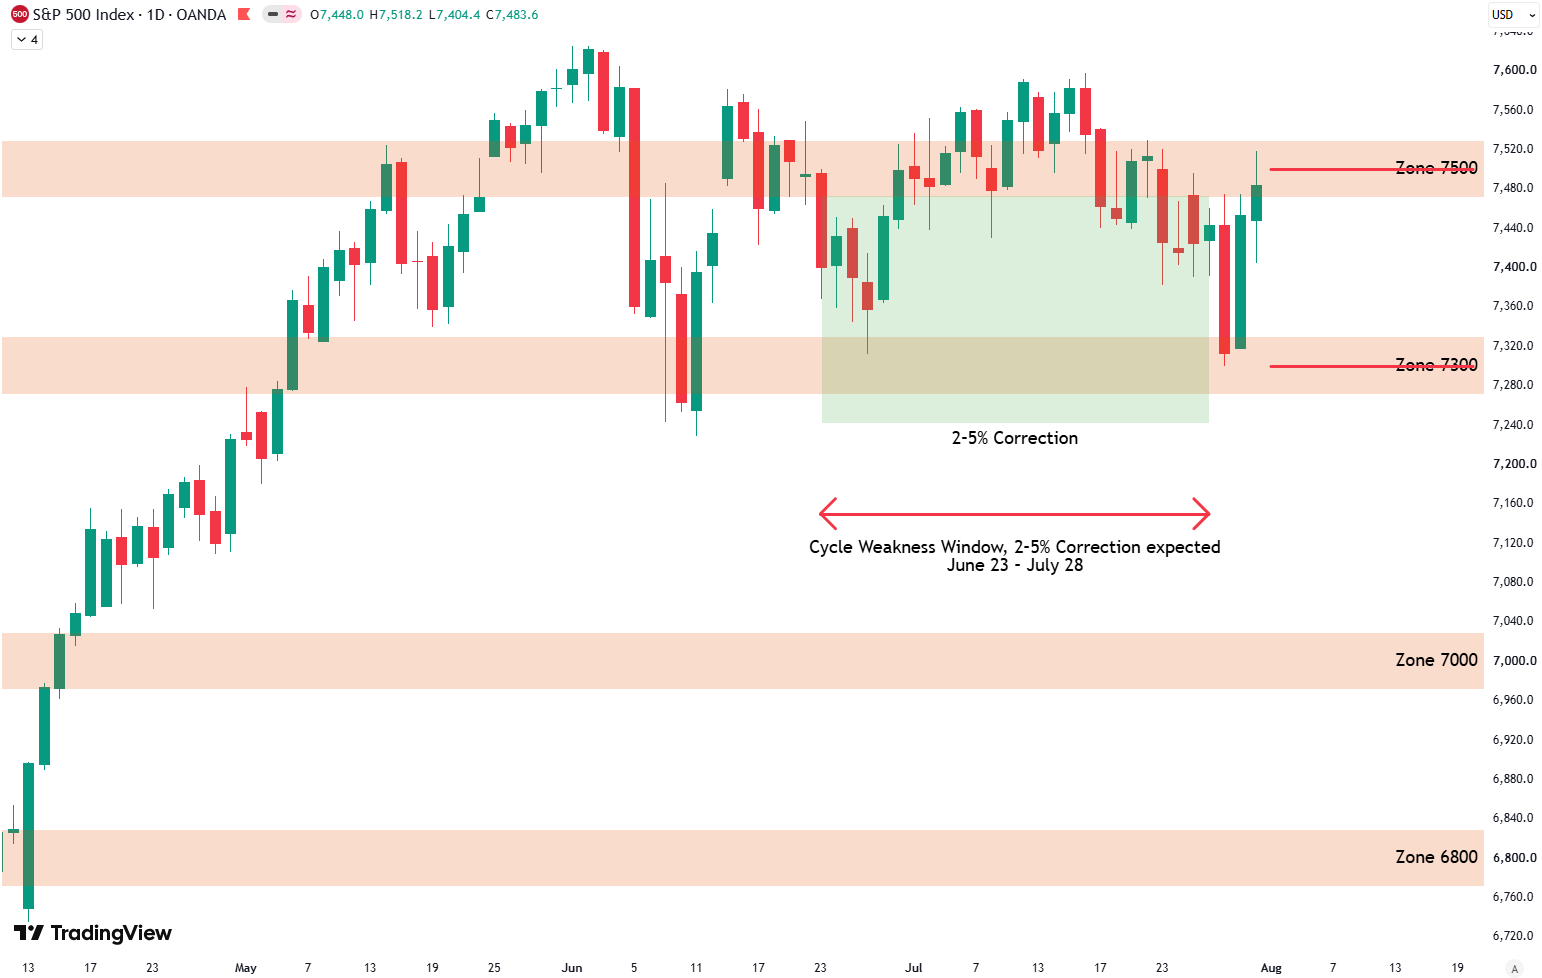
S&P 500 Weekly Analysis: 7300 Bounce & New Buy Signal
Week 31, 2026 | 0.9% | -1.8% below all time high Daily TechnicalsLevels marked in red on the chart.The S&P 500 has now basically gone nowhere in eleven weeks. Short Term Risk Bottom: Buy score in green, sell score in red, S&P 500 in black. Top right: Zoomed in version. Top left: Buy and sell…
-
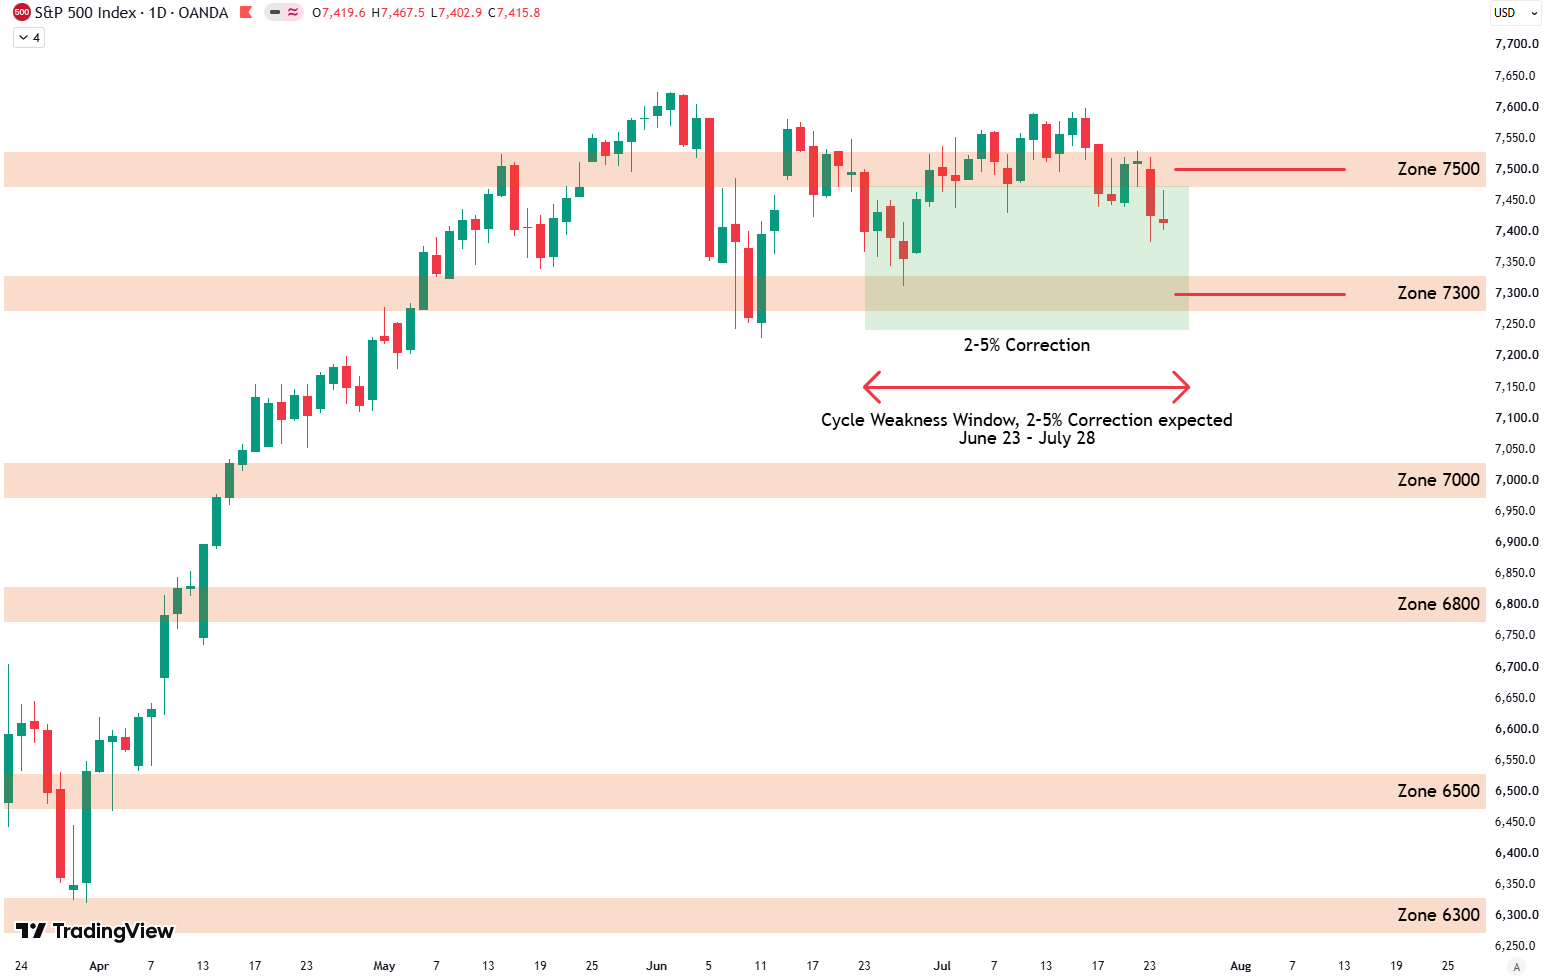
S&P 500 Weekly Analysis: Still below 7500 Line in the Sand
Week 30, 2026 | -0.6% | -2.7% below all time high Daily TechnicalsLevels marked in red on the chart.The S&P 500 has now basically gone nowhere in ten weeks. Short Term Risk Bottom: Buy score in green, sell score in red, S&P 500 in black. Top right: Zoomed in version. Top left: Buy and sell…
-
ETF Technical Analysis Strategy: When to Buy & Trim
Welcome to our ETF update. We provide an overview of different ETFs across various asset classes and base our analysis on technicals. We list some ETFs that, from a risk/reward perspective, currently look like good buy opportunities, and others that are better suited as sell or take-profit options right now. Want to know the best…
-
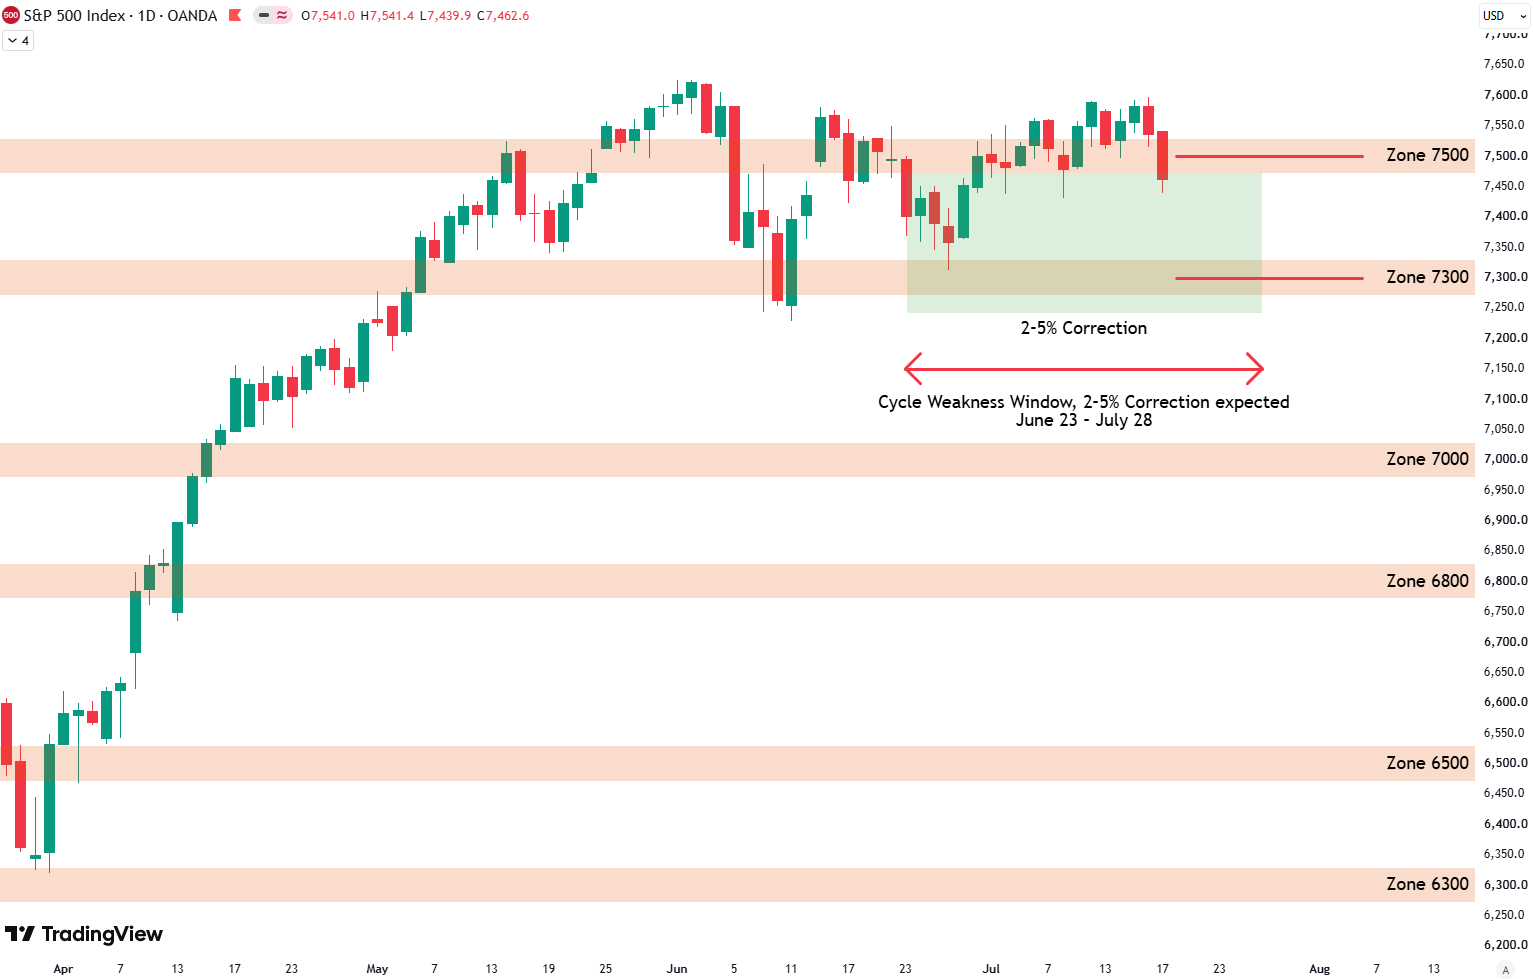
S&P 500 Weekly Analysis: Below 7500 Line in the Sand
Week 29, 2026 | -1.7% | -2.1% below all time high Daily TechnicalsLevels marked in red on the chart.The S&P 500 has now basically gone nowhere in two months. Short Term Risk Bottom: Buy score in green, sell score in red, S&P 500 in black. Top right: Zoomed in version. Top left: Buy and sell…
-
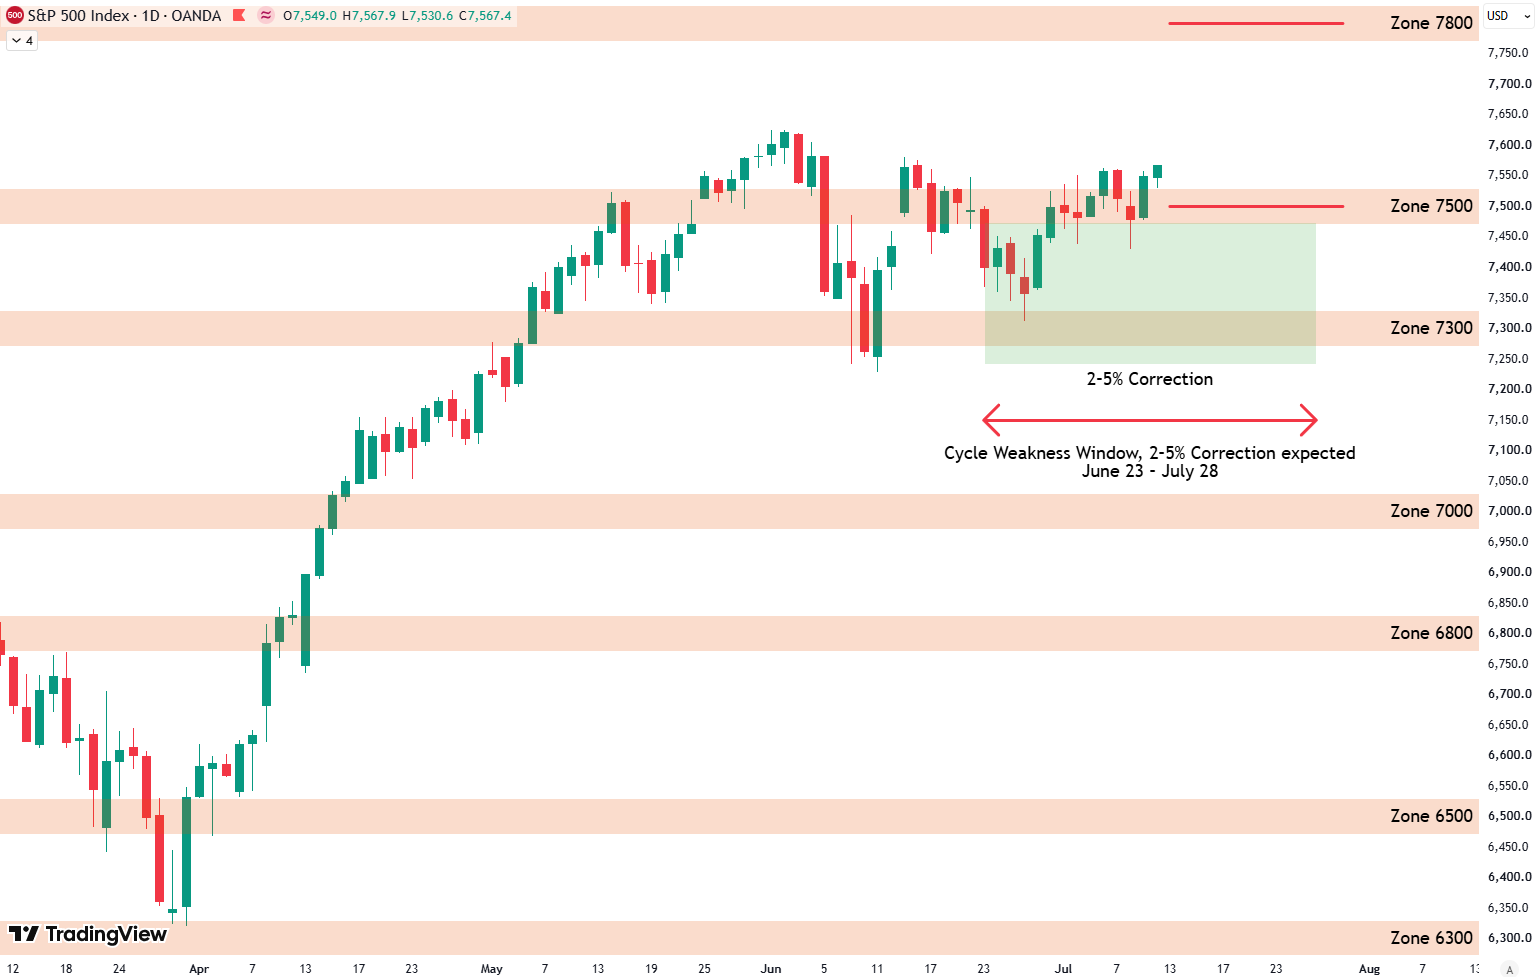
S&P 500 Weekly Analysis: 7500 Breakout & Target 7800
Week 28, 2026 | +0.7% | -0.8% below all time high Daily TechnicalsLevels marked in red on the chart.The 7800 level now becomes the primary target to the upside. Short Term Risk Bottom: Buy score in green, sell score in red, S&P 500 in black. Top right: Zoomed in version. Top left: Buy and sell…
-
ETF Technical Analysis Strategy: When to Buy & Trim
Welcome to our ETF update. We provide an overview of different ETFs across various asset classes and base our analysis on technicals. We list some ETFs that, from a risk/reward perspective, currently look like good buy opportunities, and others that are better suited as sell or take-profit options right now. Want to know the best…
-
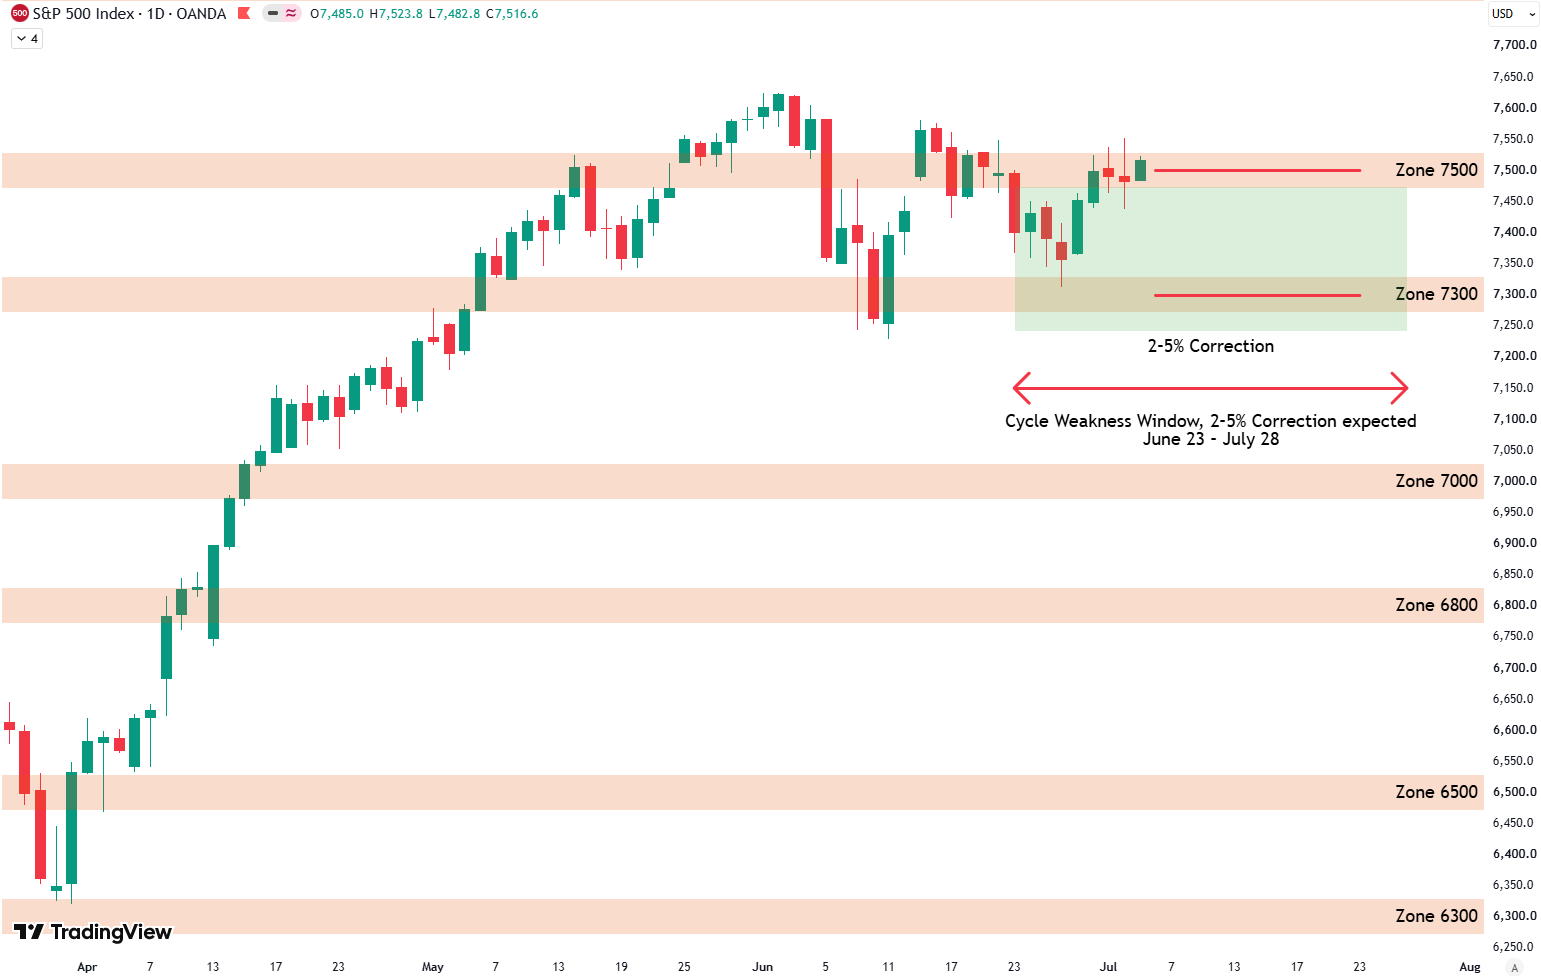
S&P 500 Weekly Analysis: 7300 Holds, 7500 Cap
Week 27, 2026 | +2.2% | -1.4% below all time high Daily TechnicalsLevels marked in red on the chart.The 7500 level becomes the line in the sand. Short Term Risk Bottom: Buy score in green, sell score in red, S&P 500 in black. Top right: Zoomed in version. Top left: Buy and sell signals as…
-
ETF Technical Analysis Strategy: When to Buy & Trim
Welcome to our ETF update. We provide an overview of different ETFs across various asset classes and base our analysis on technicals. We list some ETFs that, from a risk/reward perspective, currently look like good buy opportunities, and others that are better suited as sell or take-profit options right now. Want to know the best…