
Welcome to our weekly update on the S&P 500! This week, the S&P 500 gained 1.6%, continuing its positive momentum. The first half of the week saw relatively little movement, as traders waited for the big Federal Reserve meeting on Wednesday. As the market expected, the Fed cut rates by 0.5%, which initially triggered a market spike. However, there was a quick pullback as investors reassessed the situation. The most significant gain came on Thursday, with the market rising nearly 2% after the Fed’s decision. Along with the rate cut, weaker retail sales on Tuesday also contributed to shaping this week’s performance as you can see in the chart.

Our last position, which we placed on August 8th, has been active until September 5th, when we sold it for a gain of 7.7%
Are you wondering when to buy the S&P 500 as an investor? Explore our tailored services and join our growing community of do-it-yourself investors who have successfully navigated the market with our guidance.
Premium Guide
Advanced Investing Signals
$139 / Month
Basic Guide
Basic Investing
Signals
$49 / Month
Simple Guide
Selected
Signals
Free
Congratulations! You’ve discovered your new free financial guide. Simply sign up for our most popular service, our Simple Guide.
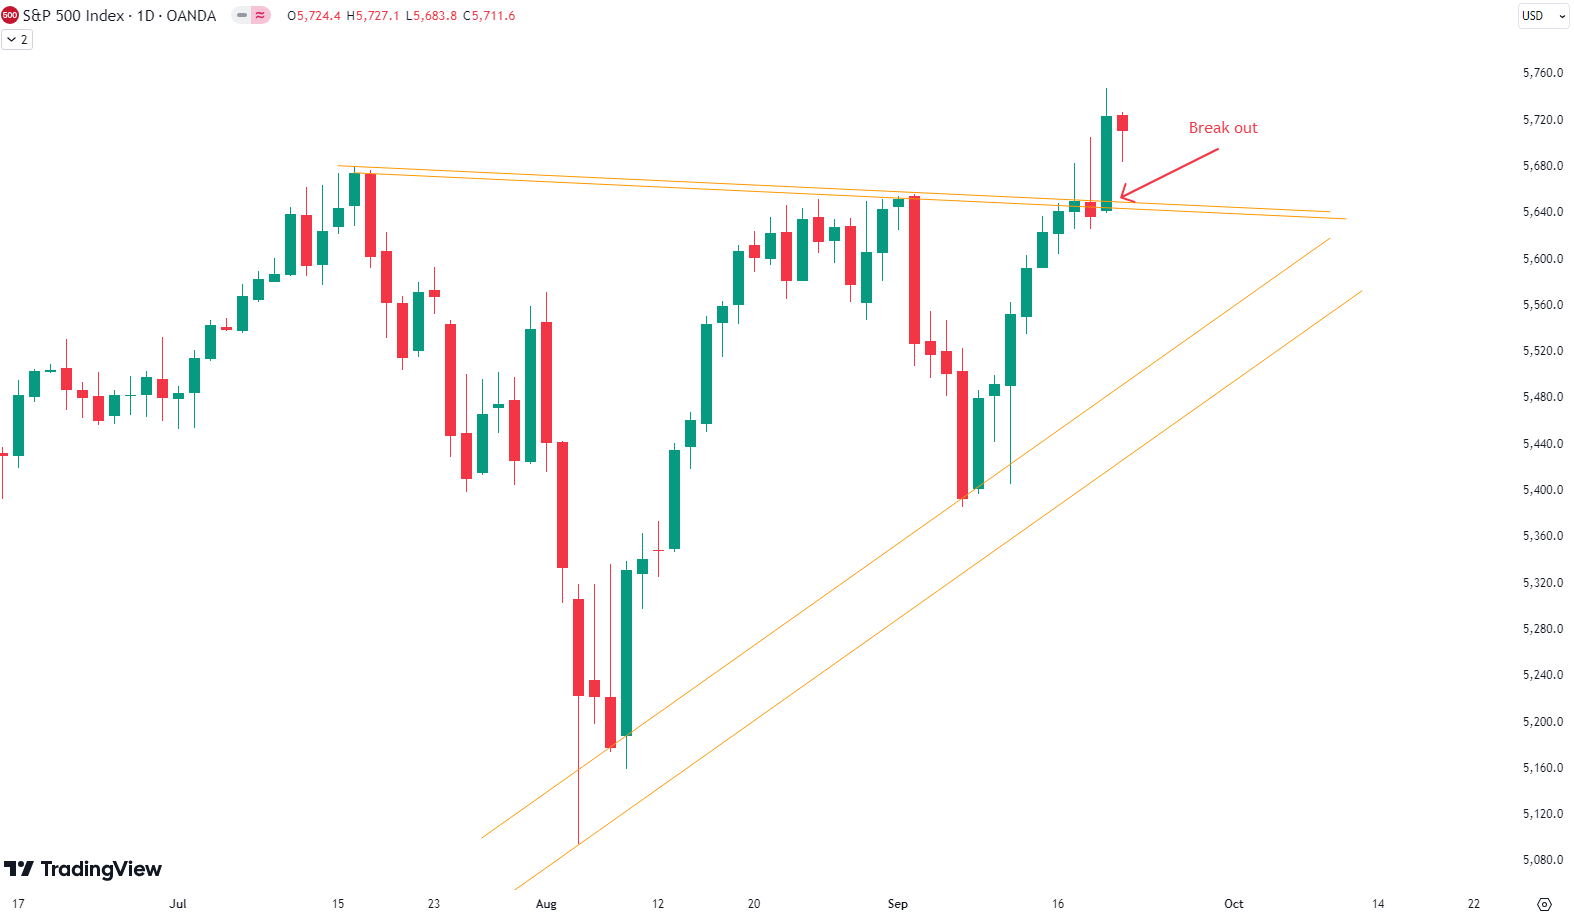
Wedge Pattern Finally Breaks
Since the August low, the S&P 500 has climbed 12.1%. Last week, we discussed the wedge formation in the market, which you can see in the chart with orange trend lines. This week, the S&P 500 finally broke out of that wedge pattern, with the decisive move happening on Thursday, the day after the Fed meeting. This breakout is seen as a bullish signal, and we could see more upside in the coming weeks. That said, we might get a brief pullback, possibly retesting the previous highs or the upper trend line. It’s important to remember that risks remain, especially with the upcoming elections. Despite the technical bullishness, the market is still somewhat overbought, although the recent correction has helped ease that condition. As always, following risk management measures is crucial, particularly in case key support zones break. Stay cautious but optimistic! The chart provides a visual breakdown of the technical pattern.
The next few months
The chart shows the typical seasonality for the S&P 500 during an election year, indicating patterns of market behavior around key months. Historically, we see a tendency for market weakness in May, June, and July, followed by a period of strong price gains up to early September. However, this is usually succeeded by a larger correction leading up to the election at the beginning of November. The period from mid-June to the end of July is characterized by some market softness, with only modest upward movement, which aligns with the recent declines we’ve witnessed. As we move into September, which is historically the weakest month of the year, we may continue to see this pattern of volatility. Given the historical data, there could be further weakness until the U.S. election on November 5th. However, it’s important to interpret this seasonality with caution, especially this year, as we have already experienced a significant rise in prices. Investors should consider both seasonality trends and our analysis for a balanced view. Proper risk management is essential in navigating these market conditions.

Our Market Dashboard provides a quick overview of the current market conditions and, more importantly, the associated risk. You can view a chart of one of our tools, the Risk Level Indicator, showing predicted risk from 1998 to 2024. If you are interested, you can visit our Dashboard site here.

The world of finance is complex and includes many technical terms. For explanations of these terms, I recommend using the Investopedia dictionary.
Leave a Reply