
This week, we are focusing on Bitcoin’s price movements and analyzing key technical indicators.
Are you wondering when to buy Bitcoin as an investor? Explore our tailored services and join our growing community of do-it-yourself investors who have successfully navigated the market with our guidance.
Premium Guide
Advanced Investing Signals
$139 / Month
Basic Guide
Basic Investing
Signals
$49 / Month
Simple Guide
Selected
Signals
Free
Congratulations! You’ve discovered your new free financial guide. Simply sign up for our most popular service, our Simple Guide.
When we look at a monthly chart of Bitcoin using a logarithmic scale, five clear trend lines appear, all running parallel to each other. These lines date back to 2017 and have consistently served as both support and resistance levels, creating a remarkably clean and impressive pattern.

Recently, Bitcoin has touched one of these trend lines again, providing a critical point for analysis. Zooming in on the weekly chart, where each candle represents one week, we can observe similar interactions with these key trend lines. These “power trend lines,” which were also visible on the monthly chart, show that in March this year, Bitcoin reached one of the upper trend lines, which acted as resistance. Following this, the price has declined over the past few months, now settling near another of these key trend lines that is currently providing support.
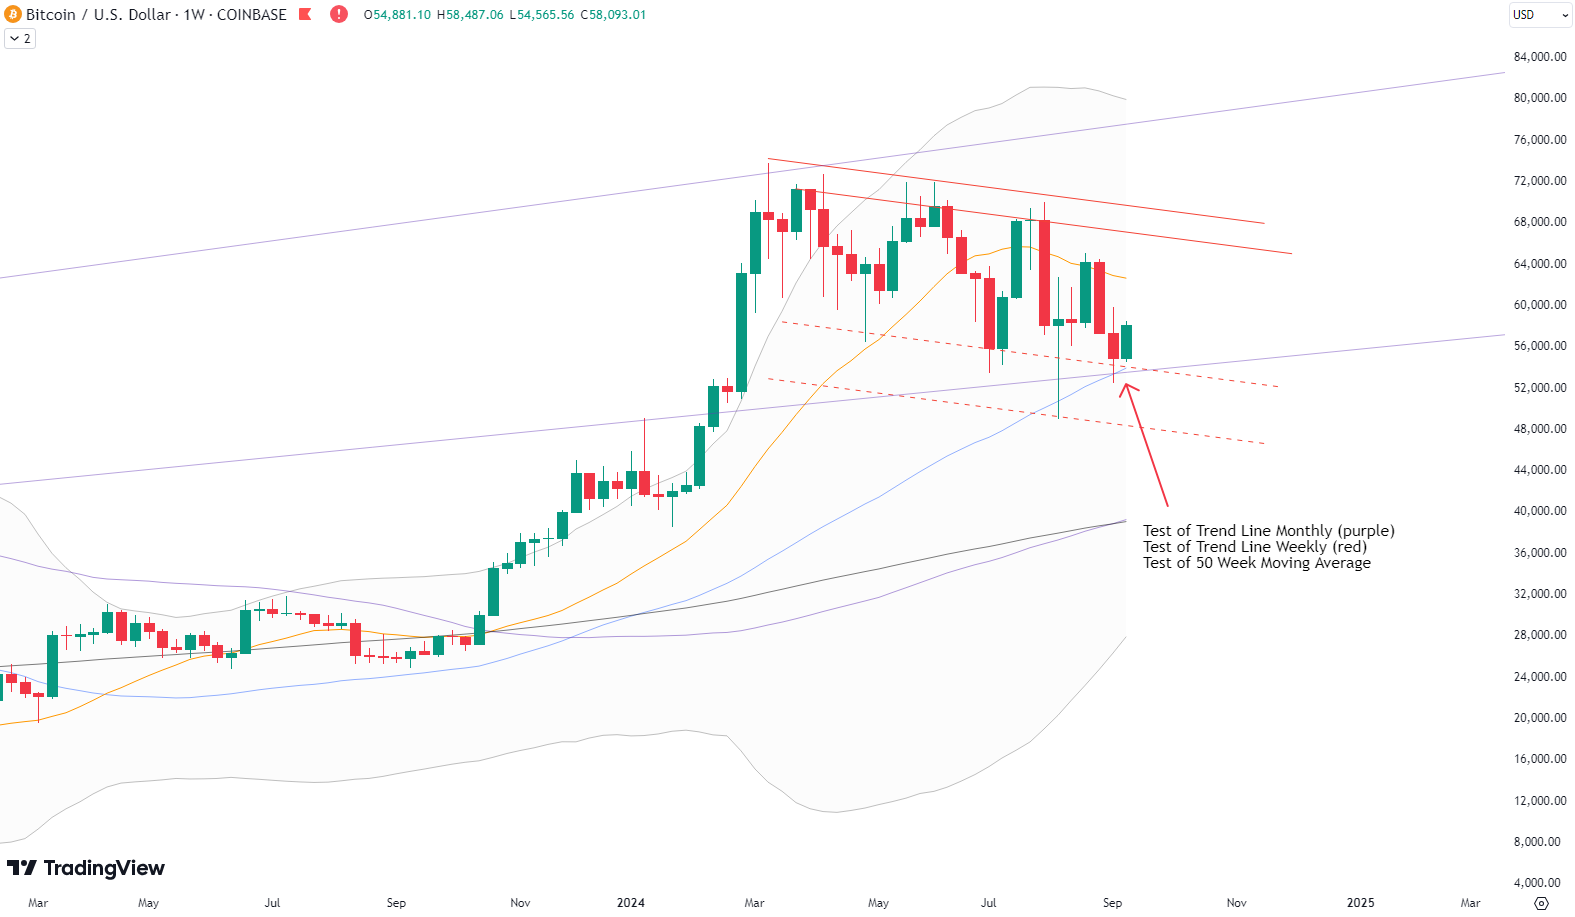
When examining the weekly chart on a regular scale, a “bull flag” pattern emerges (marked in red on the chart). This bull flag is significant because, more often than not, prices tend to break out upward from such formations. Currently, Bitcoin is positioned at the bottom of this bull flag, right at the red trend line’s support level. Additionally, when considering the moving averages, Bitcoin is testing its 50-week moving average (represented by the blue line), a crucial indicator that also appears to provide support. All of these elements—monthly trend lines, the weekly bull flag, and the 50-week moving average—suggest a strong bullish setup for Bitcoin. While the price could still break downward, buying at these support levels is often a favorable strategy for tilting the odds in your favor. With multiple supports below the current price, the outlook seems promising for those looking to invest.
The world of finance is complex and includes many technical terms. For explanations of these terms, I recommend using the Investopedia dictionary.
Leave a Reply