
Welcome to our weekly newsletter on the S&P 500. This week, the index saw a minimal gain of just 0.2%. The market showed little overall movement, fluctuating slightly on Monday and Tuesday. A sharp drop occurred on Wednesday, with the S&P 500 falling by 1.5%, driven by reactions to NVIDIA’s earnings report. However, Thursday brought a 1.8% rise, recovering all the previous day’s losses. In summary, the S&P 500 remained relatively flat throughout the week, with limited overall direction and not much significant movement.

Our last position, placed on August 8th, is currently up by 17.6%.
Are you wondering when to buy the S&P 500 as an investor? Explore our tailored services and join our growing community of do-it-yourself investors who have successfully navigated the market with our guidance.
Premium Guide
Advanced Investing Signals
$139 / Month
Basic Guide
Basic Investing
Signals
$49 / Month
Simple Guide
Selected
Signals
Free
Congratulations! You’ve discovered your new free financial guide. Simply sign up for our most popular service, our Simple Guide.
Since hitting its low in August, the S&P 500 has gained 10.8%, but it now finds itself trapped between a support zone below and a resistance zone above. As indicated in red and green on the chart, the resistance level is essentially the all-time high. We have previously discussed how the S&P 500 has struggled to break through either of these zones, and this week has been no different. Each day, the index made attempts to breach the resistance zone, marked in red, but failed to make a significant move. On Thursday, following NVIDIA’s earnings report, the index dropped back down to the support level but quickly bounced back toward resistance again. This repeated back-and-forth movement is helping to ease the overbought conditions in the short term, making a slight rally possible. However, it is crucial to remain cautious, as the market still appears overbought on a longer-term basis. Additionally, our risk indicators are signaling elevated risks in the months ahead. This is reflected in our market dashboard, which suggests a need for caution at this stage. With the current uncertainty, there isn’t much action to take right now — it might be best to wait for the situation to become clearer. For our subscribers, it is essential to follow our risk management measures we provide, which are designed to protect against potential losses in the event that the support zones are breached.

The next few months
The chart shows the typical seasonality for the S&P 500 during an election year, indicating patterns of market behavior around key months. Historically, we see a tendency for market weakness in May, June, and July, followed by a period of strong price gains up to early September. However, this is usually succeeded by a larger correction leading up to the election at the beginning of November. The period from mid-June to the end of July is characterized by some market softness, with only modest upward movement, which aligns with the recent declines we’ve witnessed. As we move into September, which is historically the weakest month of the year, we may continue to see this pattern of volatility. Given the historical data, there could be further weakness until the U.S. election on November 5th. However, it’s important to interpret this seasonality with caution, especially this year, as we have already experienced a significant rise in prices. Investors should consider both seasonality trends and our analysis for a balanced view. Proper risk management is essential in navigating these market conditions.

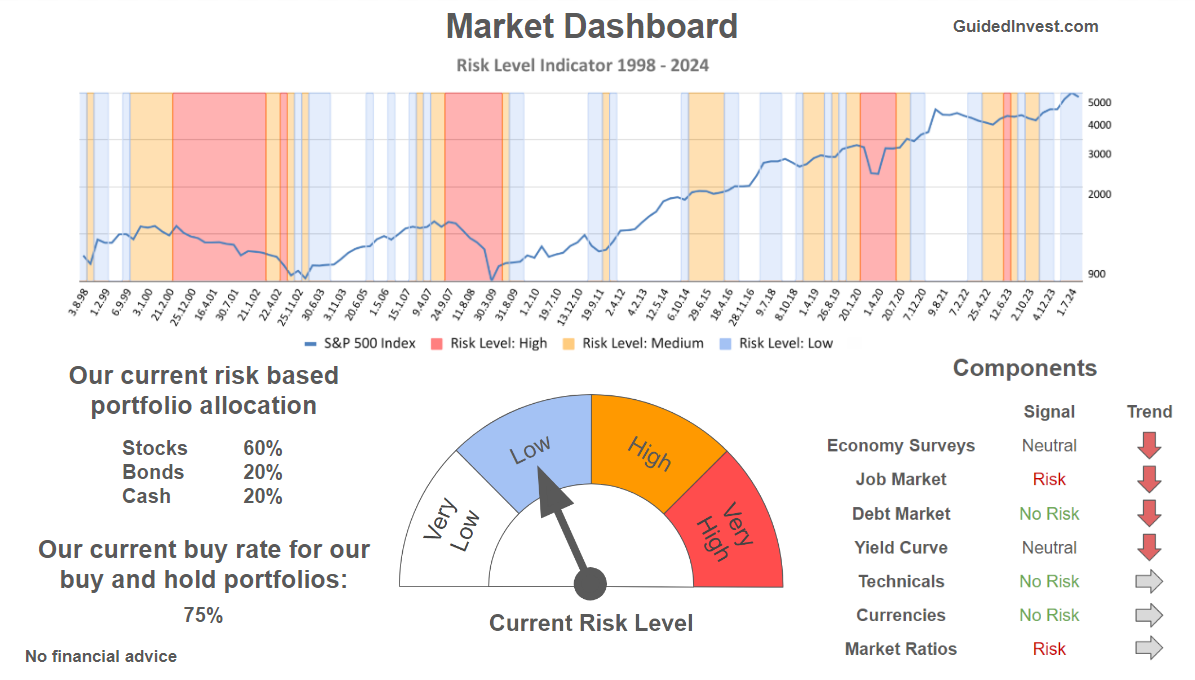
Our Market Dashboard provides a quick overview of the current market conditions and, more importantly, the associated risk. You can view a chart of one of our tools, the Risk Level Indicator, showing predicted risk from 1998 to 2024. If you are interested, you can visit our Dashboard site here.
The world of finance is complex and includes many technical terms. For explanations of these terms, I recommend using the Investopedia dictionary.
Leave a Reply