
Welcome to our weekly newsletter on the S&P 500. This week, the S&P 500 posted an impressive gain of 4%, with strong upward momentum on Tuesday, Wednesday, and Thursday. After weeks of high volatility and uncertainty, this robust rally, which closely follows the gray trend line on our chart, has provided investors a much-needed opportunity to recover from recent losses. The key question now is whether this rally has the strength to continue in the coming weeks or if it represents a temporary surge that investors should consider selling into.

Our last position, placed on August 8th, is currently up by 12.7%.
Are you wondering when to buy the S&P 500 as an investor? Explore our tailored services and join our growing community of do-it-yourself investors who have successfully navigated the market with our guidance.
Premium Guide
Advanced Investing Signals
$139 / Month
Basic Guide
Basic Investing
Signals
$49 / Month
Simple Guide
Selected
Signals
Free
Congratulations! You’ve discovered your new free financial guide. Simply sign up for our most popular service, our Simple Guide.
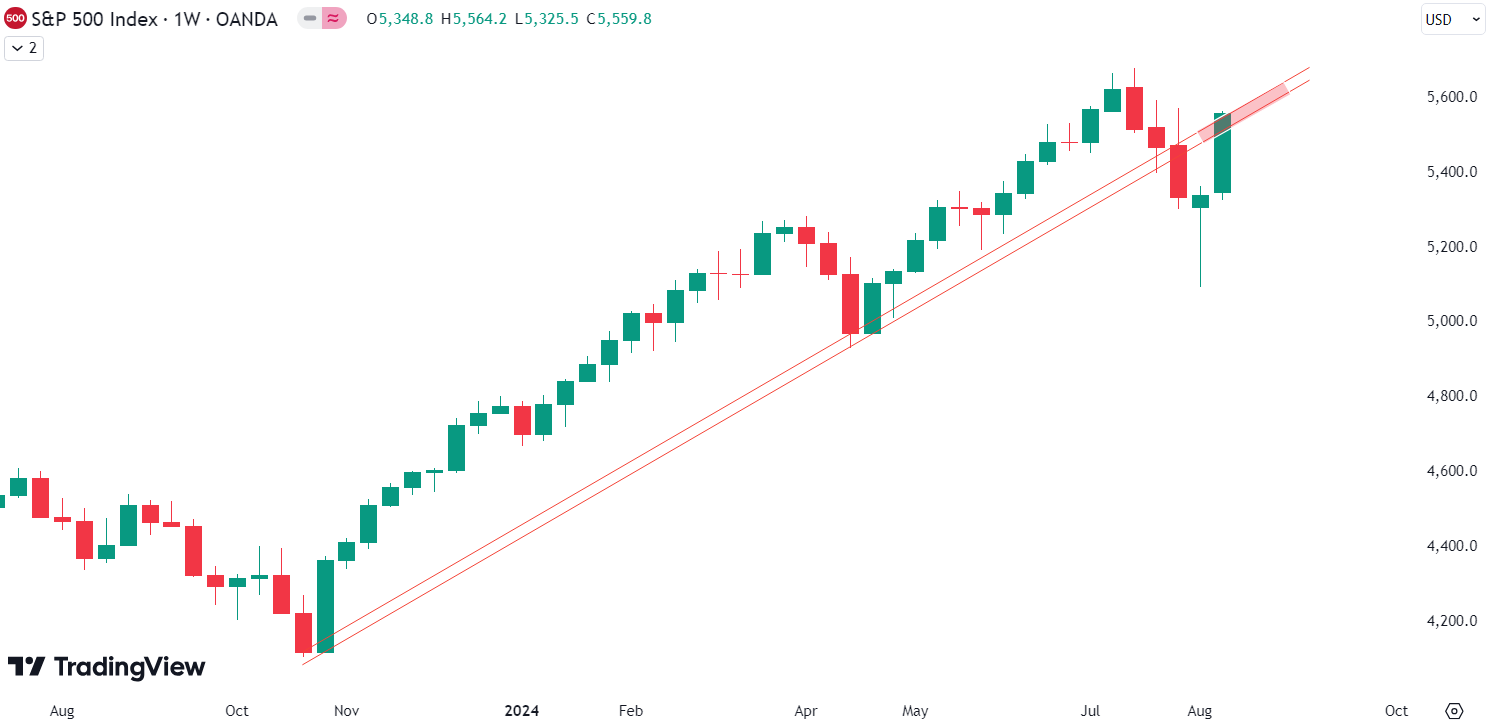
Since the August low, the S&P 500 has climbed an impressive 9.1%. After the sharp fluctuations of last week, the index managed to make significant gains this week. Previously, we discussed a resistance area that the S&P 500 struggled to break through. However, this week the index surged past that resistance zone with a strong uptrend. Now, the index is once again at a crucial resistance level, defined by the red trend line on the chart, which has been guiding the uptrend since October last year. This trend line was broken during the sell-off in July, and the S&P 500 is currently testing it from below. A pullback is certainly possible at this stage, though its extent and duration remain uncertain. What we do know is that our indicators are signaling increasing risk, as highlighted on our market dashboard below. While we’re not yet in full crisis mode, the current trend of the indicators suggests that we could be heading in that direction in the coming weeks or months. Therefore, this might be an opportune moment to take some profits off the table or at least avoid entering aggressive long positions. Last week, we successfully initiated a tactical trade, which we will be monitoring closely in the days ahead. As always, it is crucial for subscribers to follow our risk management strategies provided with all our services, to protect against potential losses should support zones break. We will continue to monitor the market for new opportunities and keep you updated.
The next few months
The chart shows the seasonality for the S&P 500 in an election year, indicating anticipated weakness in May, June, and July, followed by strong price increases until early September. This is then followed by a larger correction until the election in early November. From mid-June to the end of July, seasonality suggests some weakness and only moderate price rises, which we have certainly experienced with the recent decline. Now we are in August, which seasonality suggests is the strongest month of the year with an average gain of 3%. Of course, seasonality data should be taken cautiously, especially this year, as we have already seen a significant rise in prices. Investors should consider both seasonality trends and our analysis for a balanced view. Proper risk management is essential in navigating these market conditions.

Our Market Dashboard provides a quick overview of the current market conditions and, more importantly, the associated risk. You can view a chart of one of our tools, the Risk Level Indicator, showing predicted risk from 1998 to 2024. If you are interested, you can visit our Dashboard site here.

The world of finance is complex and includes many technical terms. For explanations of these terms, I recommend using the Investopedia dictionary.
Leave a Reply