
Welcome to our weekly newsletter on the S&P 500. This week, the S&P 500 experienced a loss of 2.5%. The first three days of the week appeared promising, highlighted by a notable 2.4% rally on Wednesday. However, the optimism was short-lived. On Thursday, the S&P 500 abruptly declined 2.5% in just a few hours, a dramatic drop that caught many by surprise. The downturn continued on Friday, resulting in further losses and bringing an end to a highly volatile week.
Our last short position, which we placed on July 18th, has been active until July 31th, when we sold it for a gain of 1,9%
Are you wondering when to buy the S&P 500 as an investor? Explore our tailored services and join our growing community of do-it-yourself investors who have successfully navigated the market with our guidance.
Premium Guide
Advanced Investing Signals
$139 / Month
Basic Guide
Basic Investing
Signals
$49 / Month
Simple Guide
Selected
Signals
Free
Congratulations! You’ve discovered your new free financial guide. Simply sign up for our most popular service and our Simple Guide.
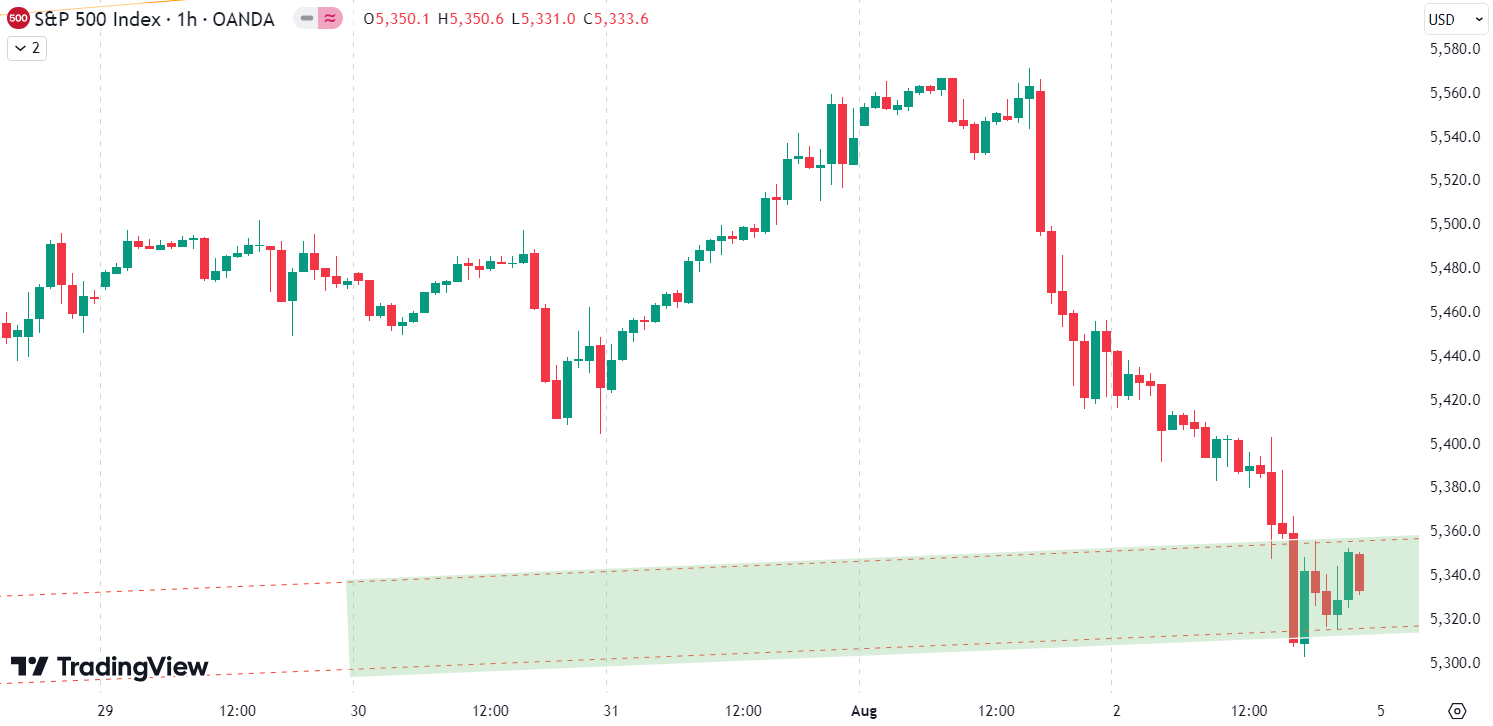
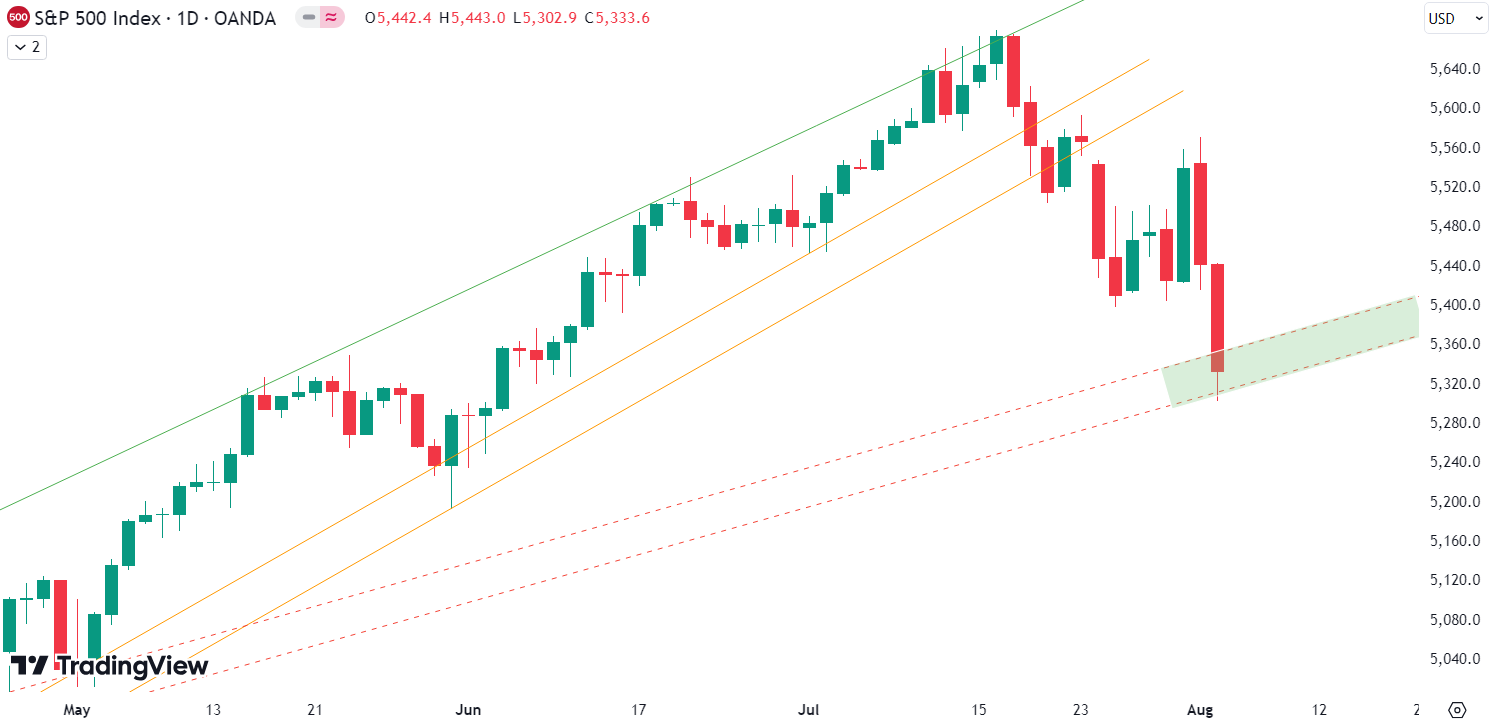
Since the July top, the S&P 500 has declined by 6%. After experiencing losses in previous weeks, this week brought further declines. Wednesday’s rally was anticipated, as sharp declines are often followed by temporary recoveries. This left investors wondering if the bottom was in, but Thursday’s sharp drop answered that question negatively. The decline this week reached our target and has now brought prices down to the support zone we discussed last week. This support zone is significant, as moving averages, trend lines, and horizontal support all converge here, forming a robust area of potential stability. We expect at least a short-term bounce from this area. The risk-reward ratios are improving, and if we observe positive price action within this support zone, we will take advantage of the situation and enter some long positions. For subscribers, it is crucial to follow our risk management measures provided with all our services to protect against losses in case support zones break. Looking at the technical indicators, it is clear that this support zone is vital for the market’s next move. The convergence of multiple support factors suggests that a bounce is likely, but the market’s reaction in this zone will be critical. Should the S&P 500 hold and rebound from this area, it would confirm the strength of this support. Conversely, a break below this zone could signal further downside risks. In summary, while the recent declines have been challenging, they have brought the S&P 500 to a crucial support level. Investors should watch closely for signs of stabilization and potential upside from this area. Following our risk management strategies will be essential in navigating these uncertain times and capitalizing on the opportunities that arise.
The next few months
The chart shows the seasonality for the S&P 500 in an election year, indicating anticipated weakness in May, June, and July, followed by strong price increases until early September. This is then followed by a larger correction until the election in early November. From mid-June to the end of July, seasonality suggests some weakness and only moderate price rises, which we have certainly experienced with the recent decline. Now we enter August, which seasonality suggests is the strongest month of the year with an average gain of 3%. Of course, seasonality data should be taken cautiously, especially this year, as we have already seen a significant rise in prices. Investors should consider both seasonality trends and our analysis for a balanced view. Proper risk management is essential in navigating these market conditions.

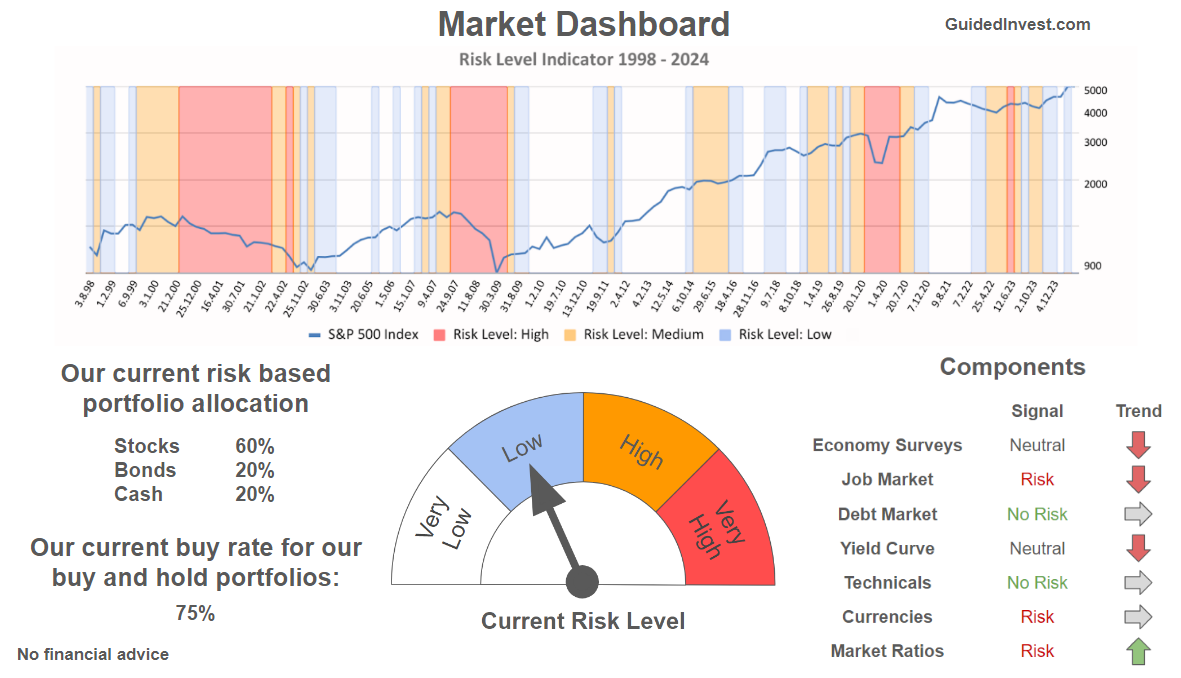
Our Market Dashboard provides a quick overview of the current market conditions and, more importantly, the associated risk. You can view a chart of one of our tools, the Risk Level Indicator, showing predicted risk from 1998 to 2024. If you are interested, you can visit our Dashboard site here.
The world of finance is complex and includes many technical terms. For explanations of these terms, I recommend using the Investopedia dictionary.
Leave a Reply