
This week, the S&P 500 gained 1%. The index continued last week’s rally, advancing further from Monday to Wednesday. However, Thursday saw strong losses after weak inflation data, which showed a -0.1% month-over-month change in June. Despite this, the market saw a complete recovery on Friday, only to experience another sell-off into the week’s close.
Our last position which we placed has been active since April 25th. The position is currently up by 31.7%.
Are you wondering when to buy the S&P 500 as an investor? Explore our tailored services and join our growing community of do-it-yourself investors who have successfully navigated the market with our guidance.
Premium Guide
Advanced Investing Signals
$139 / Month
Basic Guide
Basic Investing
Signals
$49 / Month
Simple Guide
Selected
Signals
Free
Get started with our most popular service and sign up for our Simple Guide
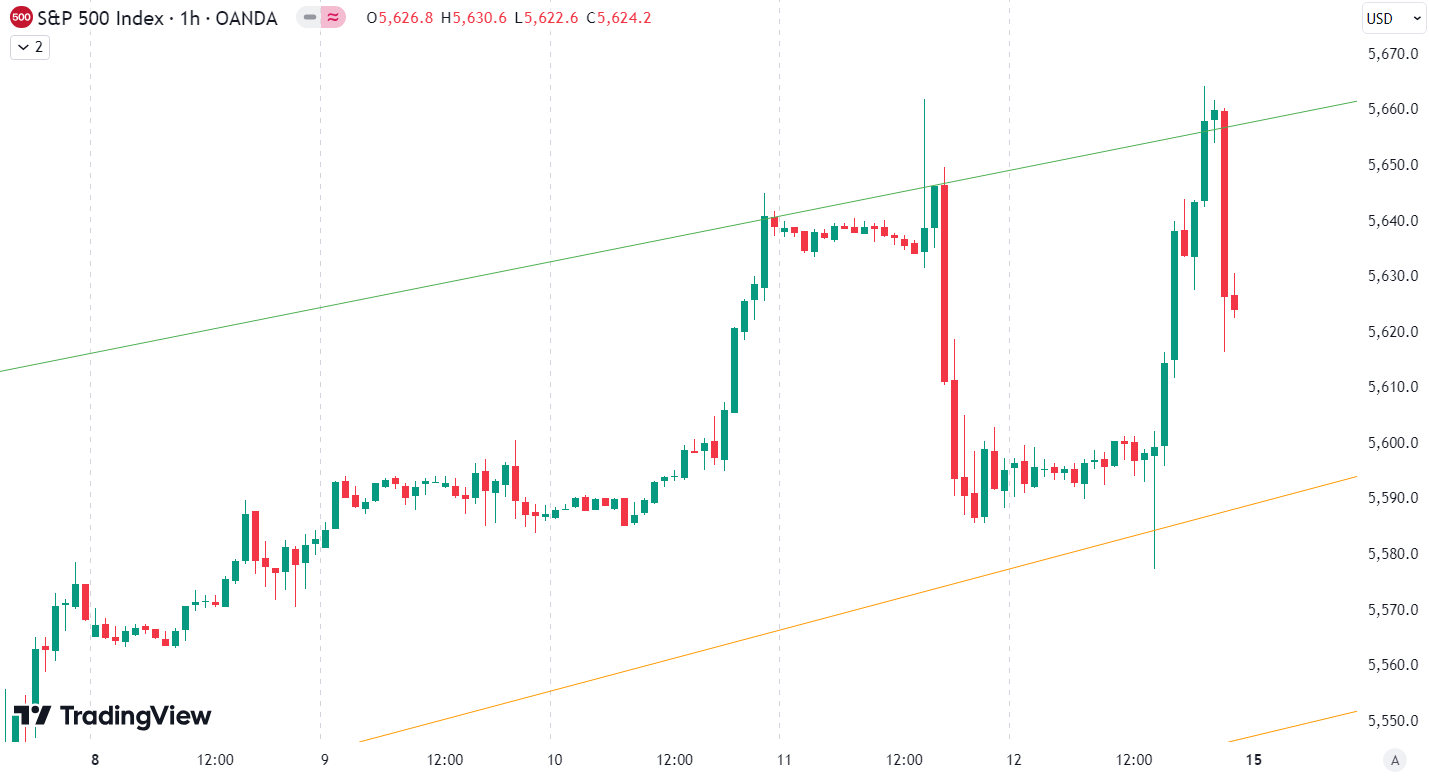
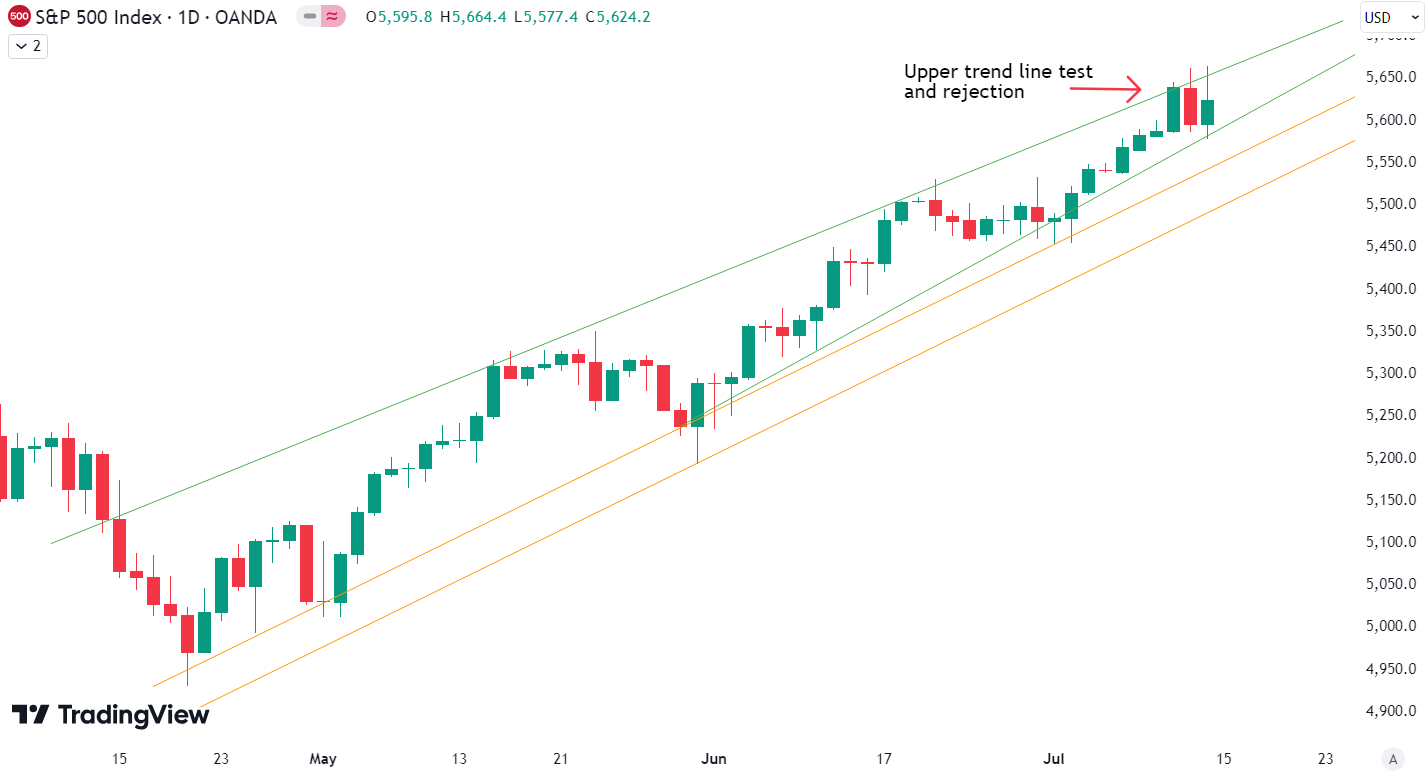
Since the April low, the S&P 500 is up 14%. After a strong performance last week, the index saw some gains this week. Last week, we mentioned the two orange trend lines that define the uptrend since the April low. This week, the upper trendline (green on the chart) was tested. With the losses on Thursday, the S&P 500 was strongly rejected by this trendline. Additionally, we can now draw a second green trendline to the downside. These two green trend lines form a wedge pattern. We now have a clear gauge on what is going on, with trendlines framing this uptrend on both the upside and downside. The wedge pattern indicates compression into an ever-smaller price range. This is typical for top formations, and if the pattern holds, it will likely break to the downside. If the wedge pattern or the orange trendlines get broken, a larger correction is probably occurring. The strong overbought conditions on the longer time frames still persist, suggesting upside remains probably limited. Because of that, there are only two things to do at the moment. First, manage risk by taking profits, reducing positions slightly, or deploying some hedges. Second, wait for better opportunities and for a resolution of the overbought conditions on the longer time frames. For subscribers, it is crucial to follow our risk management measures, which we provide with all our services, to protect against losses if support zones break. Follow us for updates and guidance on navigating these market conditions.
The next few months
On the chart, you can see the seasonality for the S&P 500 in an election year, which anticipates weakness in May and then strongly rising prices until early September. This is followed by a bigger correction until the election in early November. From mid-June to the end of July, seasonality suggests some weakness and only moderate rising prices. This fits very well with our current analysis of overextension to the upside and the probability of some pullback. Of course, the seasonality data should be taken cautiously, especially this year because we have already had a significant rise in prices. Investors should consider both seasonality trends and our analysis for a balanced view. Proper risk management is essential in navigating these market conditions.

Our Market Dashboard provides a quick overview of the current market conditions and, more importantly, the associated risk. You can view a chart of one of our tools, the Risk Level Indicator, showing predicted risk from 1998 to 2024. If you are interested, you can visit our Dashboard site here.

The world of finance is complex and includes many technical terms. For explanations of these terms, I recommend using the Investopedia dictionary.
Leave a Reply