
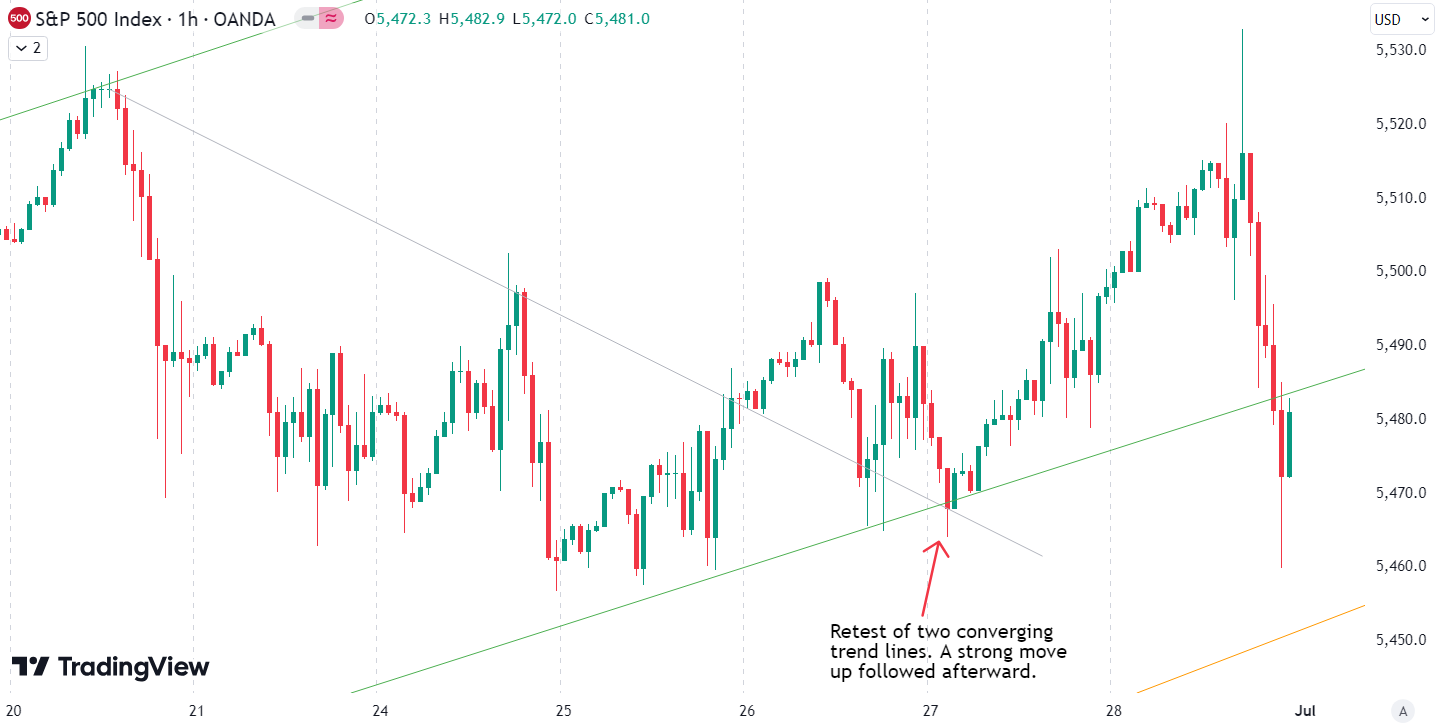
This week, the S&P 500 had no gain and finished the week where it started, with a lot of ups and downs, rallies on Tuesday and Thursday, and a sharp drop-off on Friday. On a one-hour chart, it is interesting to notice the retest that occurred on Thursday followed by strong move up. Two converging trend lines were tested at the same time. One is the trend line that defined the downward price action that occurred since Thursday last week (gray). The other one is a longer trend line that defines the still intact upward trend since the April low (green). This very nicely presents an example of how good technical analysis can work if performed correctly. Notice how on Friday, at the sharp sell-off at the end of the day, the green trend line was broken, but the index managed to rally back to it in the last trading hour of the week.
Our last position which we placed has been active since April 25th. The position is currently up by 24%.
Are you wondering when to buy the S&P 500 as an investor? Explore our tailored services and join our growing community of do-it-yourself investors who have successfully navigated the market with our guidance.
Premium Guide
Advanced Investing Signals
$139 / Month
Basic Guide
Basic Investing
Signals
$49 / Month
Simple Guide
Selected
Signals
Free
Get started with our most popular service and sign up for our Simple Guide
Since the April low, the S&P 500 is up 11.2%. The index had a strong move up three weeks in a row, but this week only moved sideways. As anticipated in our last article, upside was limited this week. On the chart, you can see two trend lines in orange that define the uptrend since the April low. If those get broken, a larger correction is probably occurring. Also, the green trend line from above is displayed for reference. The strong overbought conditions on the longer time frames still persist and suggest upside remains probably limited. Because of that, there is not much to do at the moment but two things. First is to manage risk: take profits, reduce positions a little bit, or deploy some hedges. Second is to wait for better opportunities and for a resolution of the overbought conditions on the longer time frames. The sharp sell-off on Friday may indicate further corrective action next week. This is fine; there is still enough space to come back to those orange trend lines to improve the overall risk/reward ratio. For subscribers, it is very important to follow our risk management measures that we provide with all our services to protect against losses in case support zones break. Follow us for updates and guidance on navigating these market conditions.

The next few months
On the chart, you can see the seasonality for the S&P 500 in an election year, which anticipates weakness in May and then strongly rising prices until early September. This is followed by a bigger correction until the election in early November. From mid-June to the end of July, seasonality suggests some weakness and only moderate rising prices. This fits very well with our current analysis of overextension to the upside and the probability of some pullback. Of course, the seasonality data should be taken cautiously, especially this year because we have already had a significant rise in prices. Investors should consider both seasonality trends and our analysis for a balanced view. Proper risk management is essential in navigating these market conditions.

The macroeconomic environment is showing negative signs, with our Risk Level Indicator (RLI) increasingly confirming this outlook through various signals. The risk of a credit event remains elevated, adding to the prevailing economic concerns. Of particular note is the Federal Reserve’s Bank Term Funding Program (BTFP), which was initiated in response to last year’s banking crisis to aid banks struggling with high interest rates. However, this program has now expired, and banks are required to gradually repay the loans to the Fed over the course of a year. The RLI will promptly identify emerging issues and adjust the risk level accordingly, providing valuable insights for investors. Currently, a somewhat defensive allocation in stocks is advisable, given the uncertain economic climate.
The world of finance is complex and includes many technical terms. For explanations of these terms, I recommend using the Investopedia dictionary.
Leave a Reply