
Week 27, 2026 | +2.2% | -1.4% below all time high
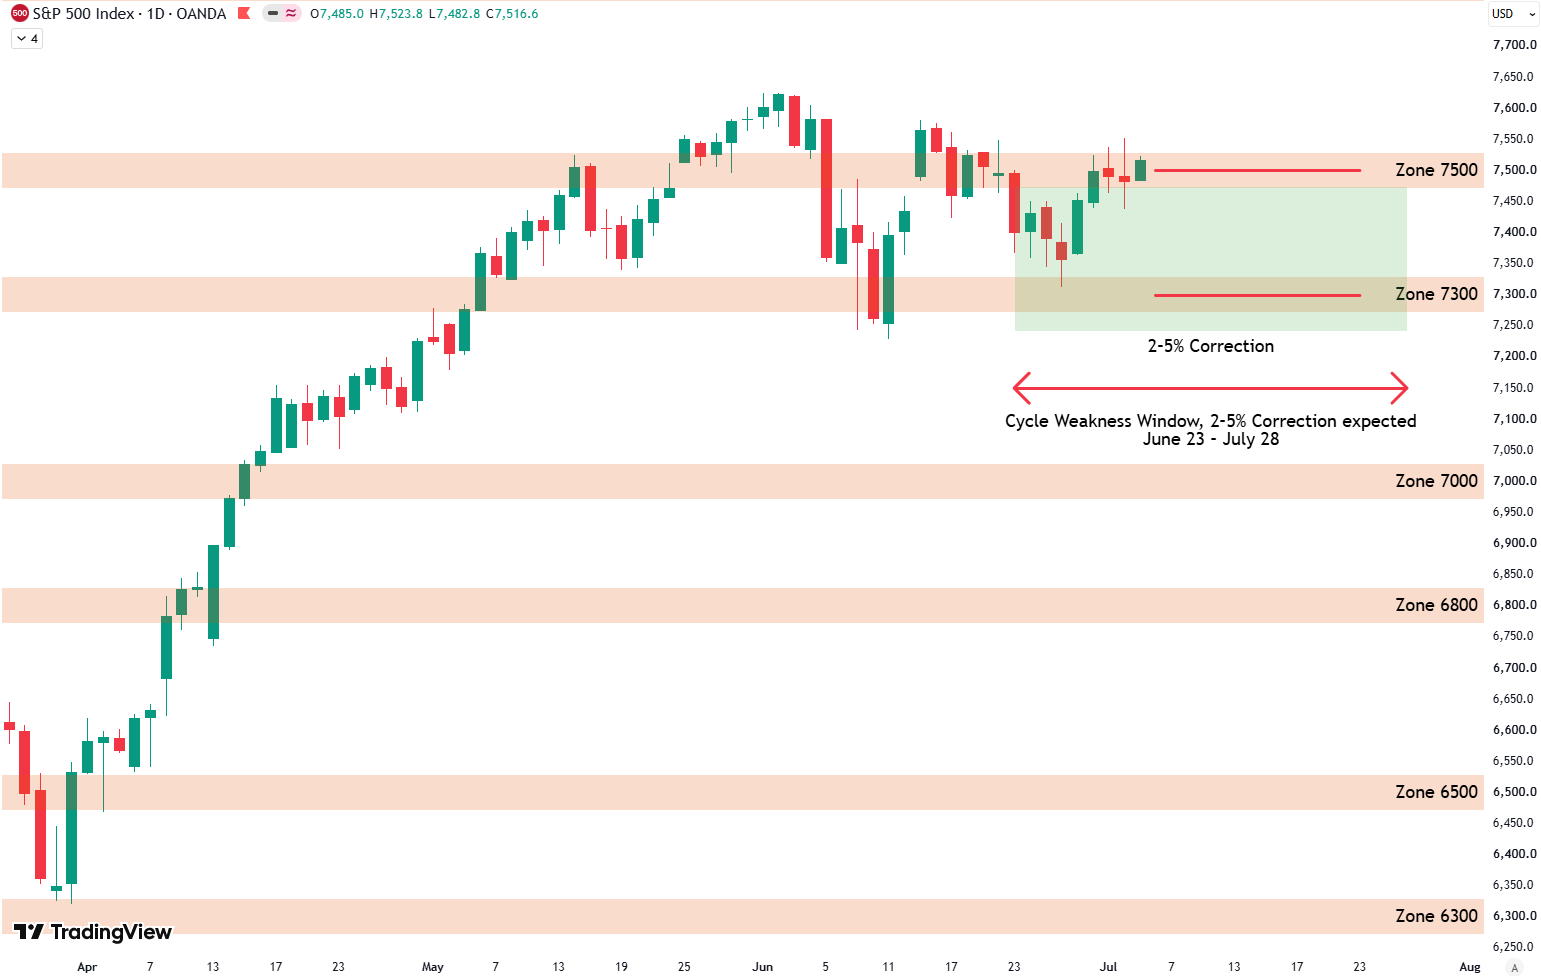
- The S&P 500 retests 7300 and the important level holds again.
- The 7500 zone caps the price still to the upside.
- The S&P 500 is currently in another cycle of weakness from June 23 to July 28 where an expected 2% to 5% correction is shown by the green box on the chart.
- This expected correction target is met with the retest of 7300 at the end of June.
Daily Technicals
Levels marked in red on the chart.
The 7500 level becomes the line in the sand.
- Bullish at 7300.
- Bearish at 7500.
Short Term Risk
- No signal this week.
- The buy score increased this week but has not triggered a buy signal.
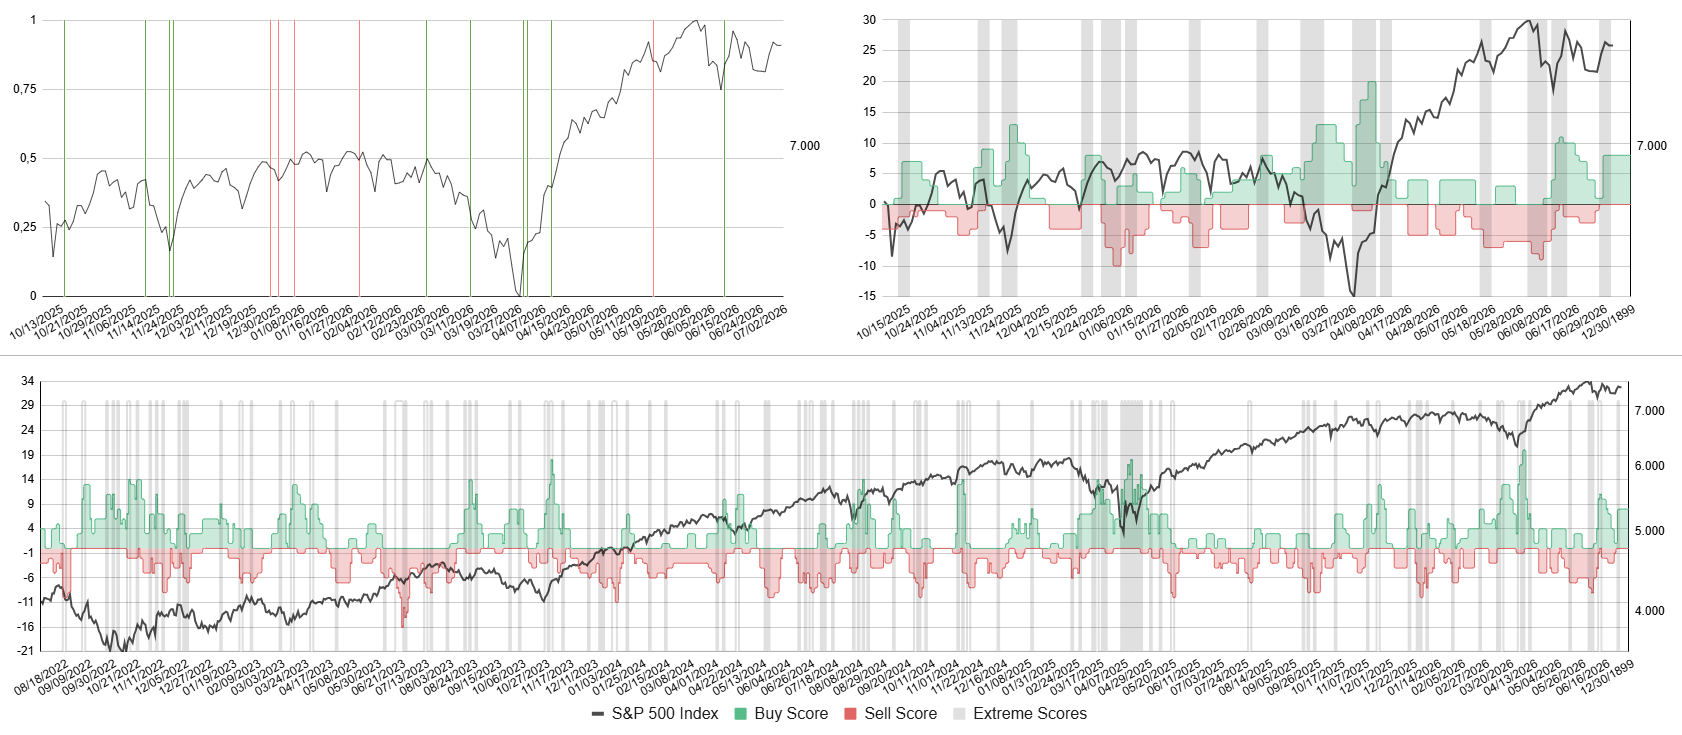
Bottom: Buy score in green, sell score in red, S&P 500 in black.
Top right: Zoomed in version. Top left: Buy and sell signals as vertical lines.
Sign up with your email for free to receive buy and sell signals as soon as they occur:
Long Term Risk
Very Low Risk | Low Risk | Elevated Risk | High Risk | Very High Risk
- Risk level change.
- The mid term risk indicator shifted from high to very high.
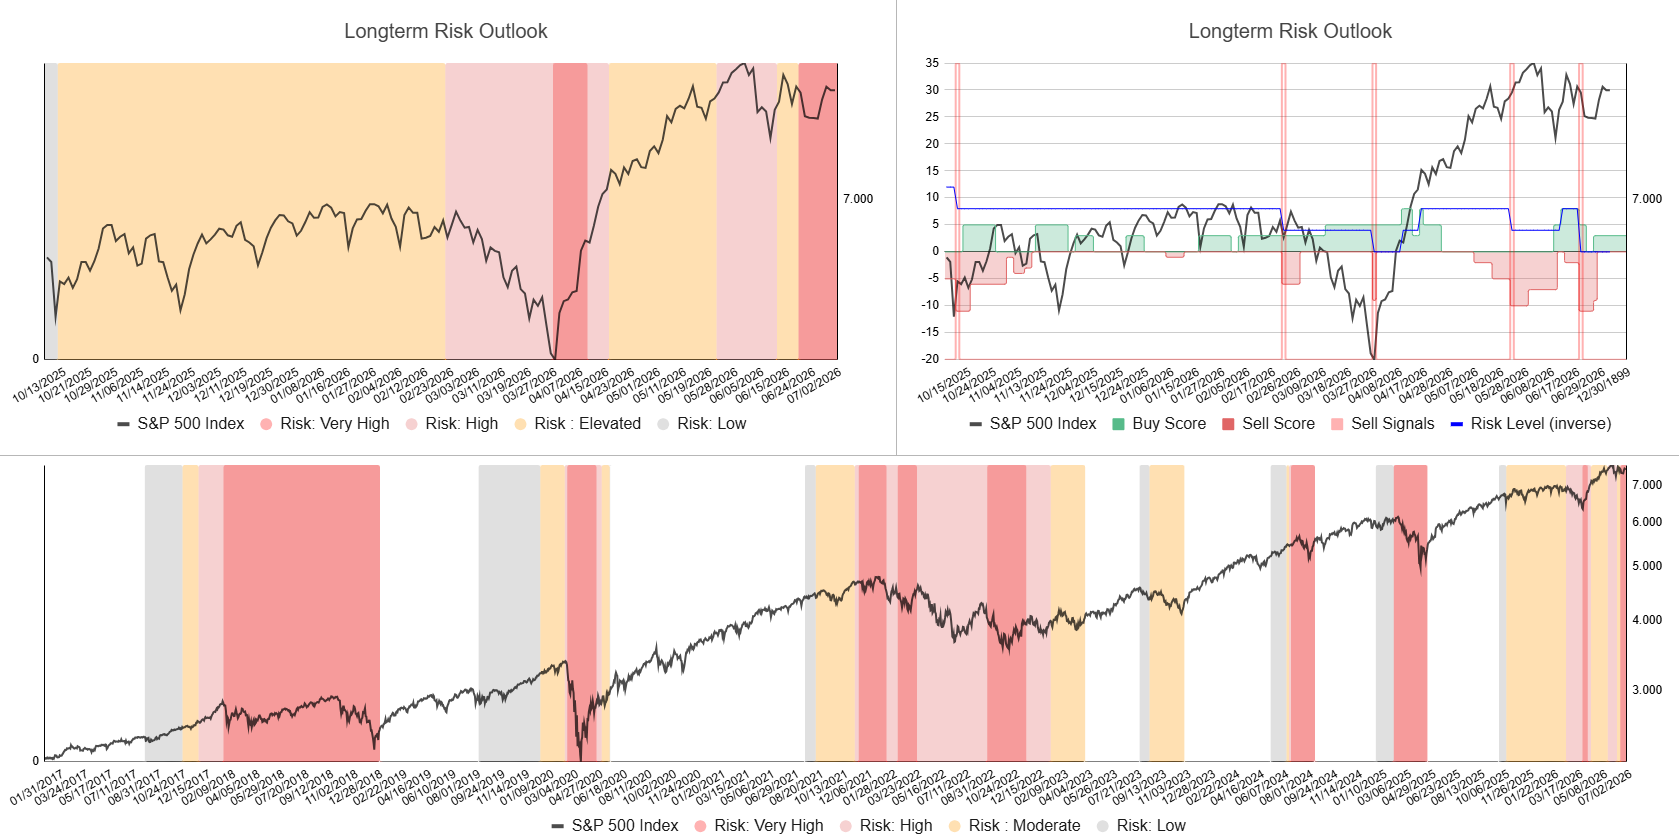
Top: Indicator with internal signals determining risk levels.
Bottom: S&P 500 in black with risk regimes ranging from very low to very high (white, grey, orange and red shaded areas).
Seasonality
- Very strong July.
- Seasonality suggests a very strong Q3 start, followed by weakness in August and September.

Dashboard
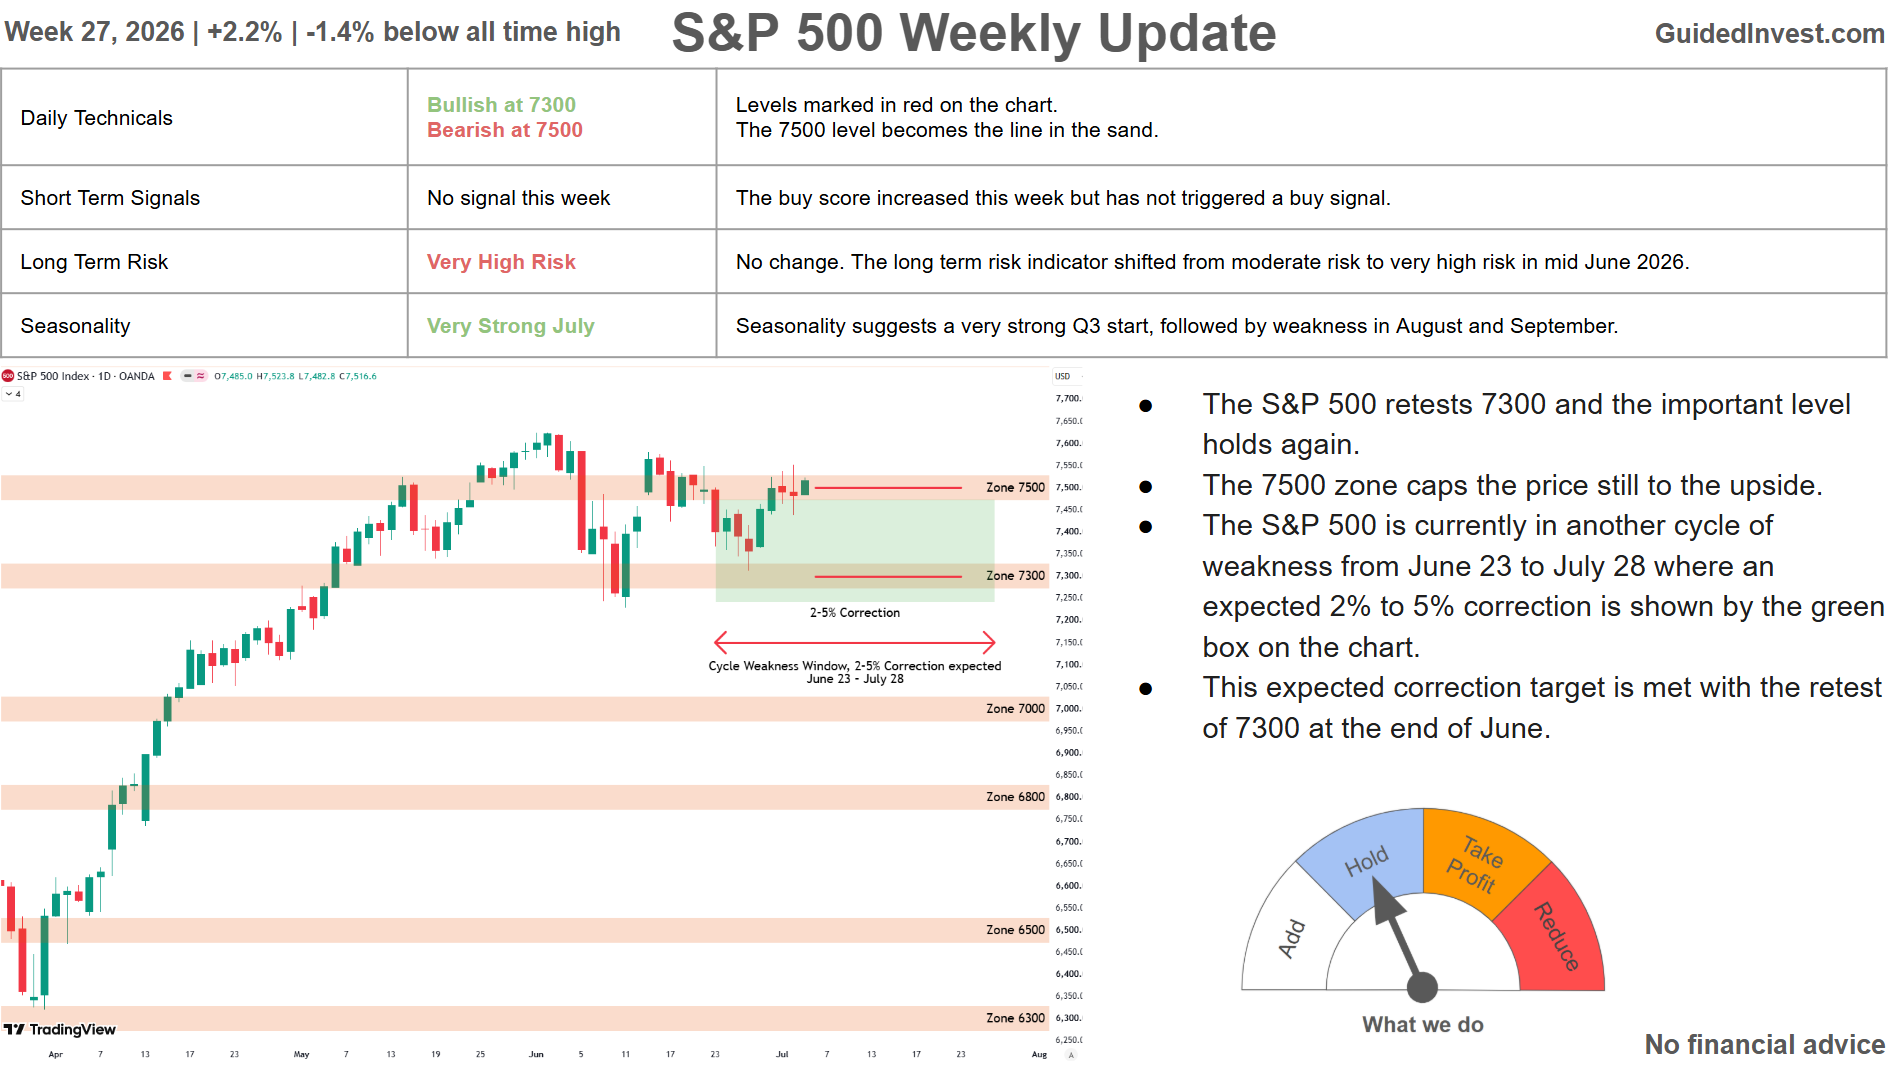
All information summarized in our dashboard:
Stay ahead of the market! Sign up for our weekly updates and get additional expert insights on the S&P 500, key support levels, and market trends.
Leave a Reply