
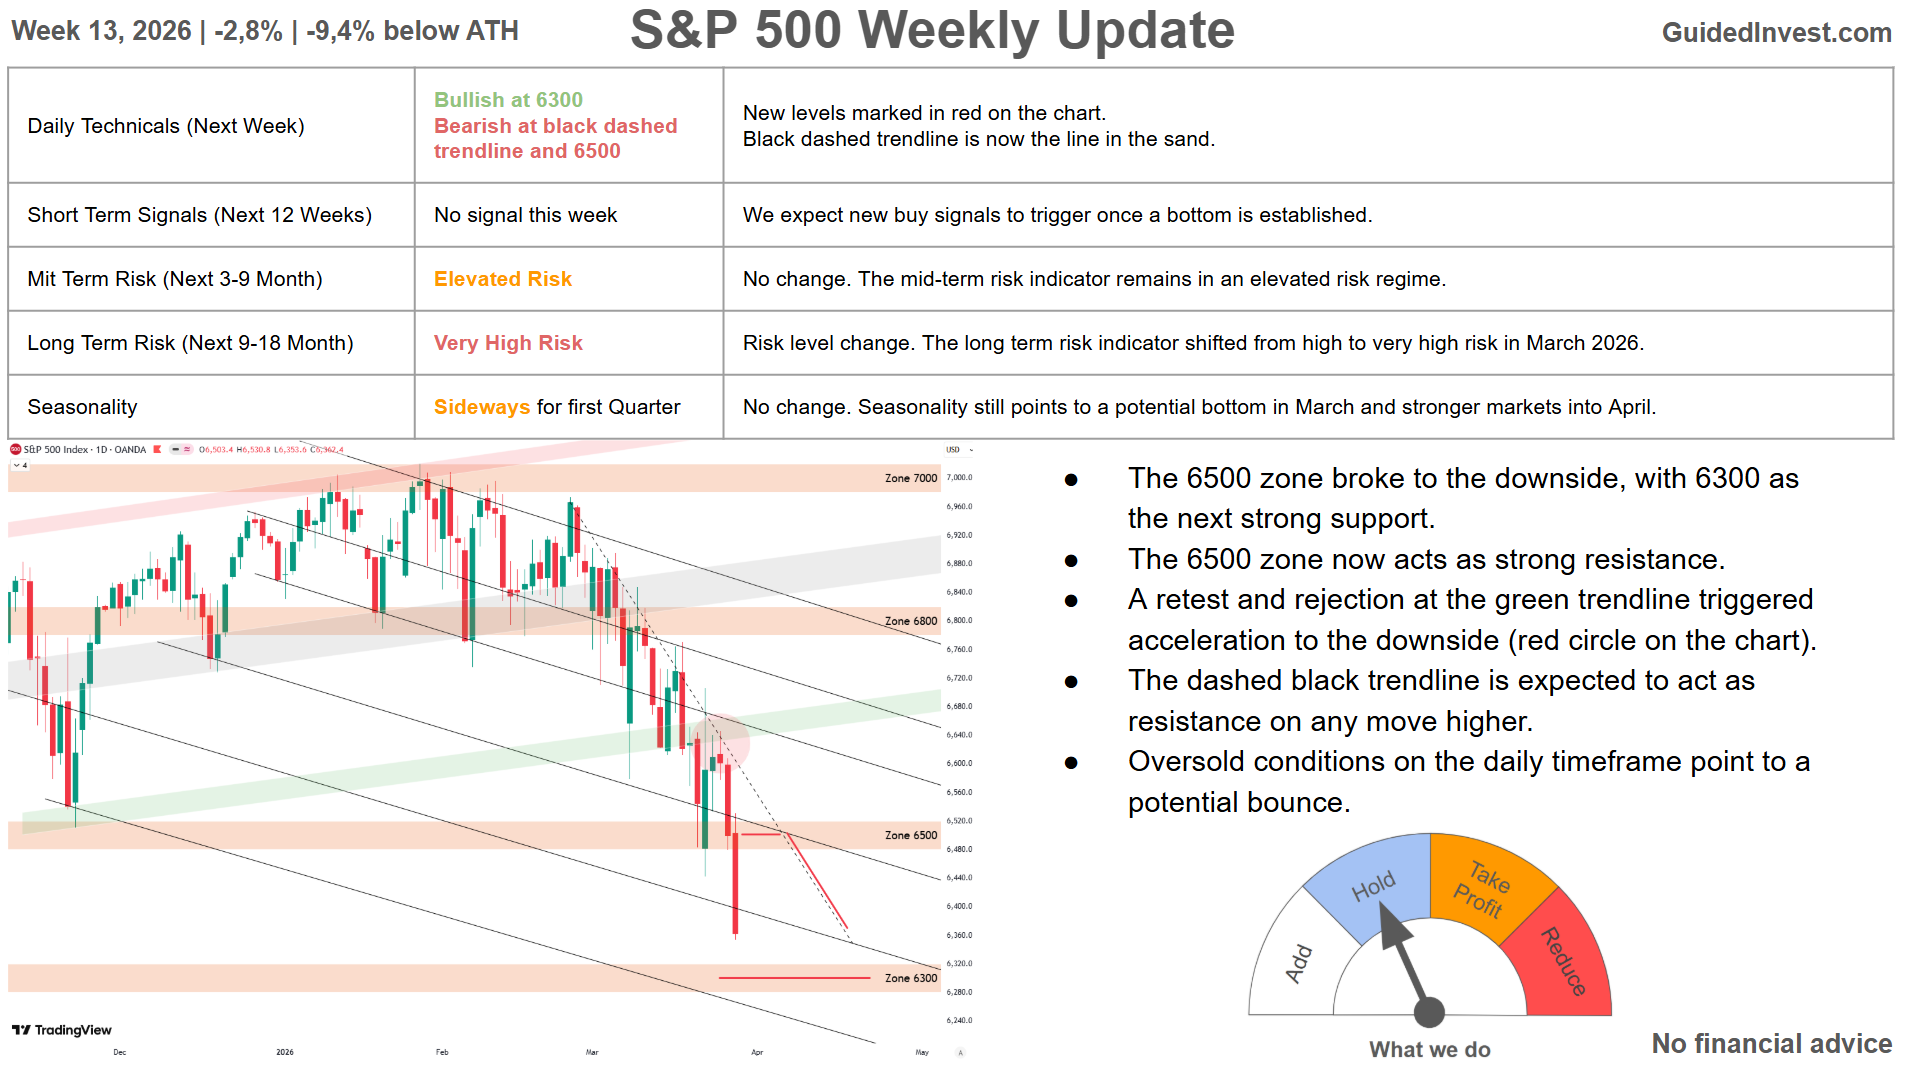
Week 13, 2026 | -2,8% | -9,4% below ATH
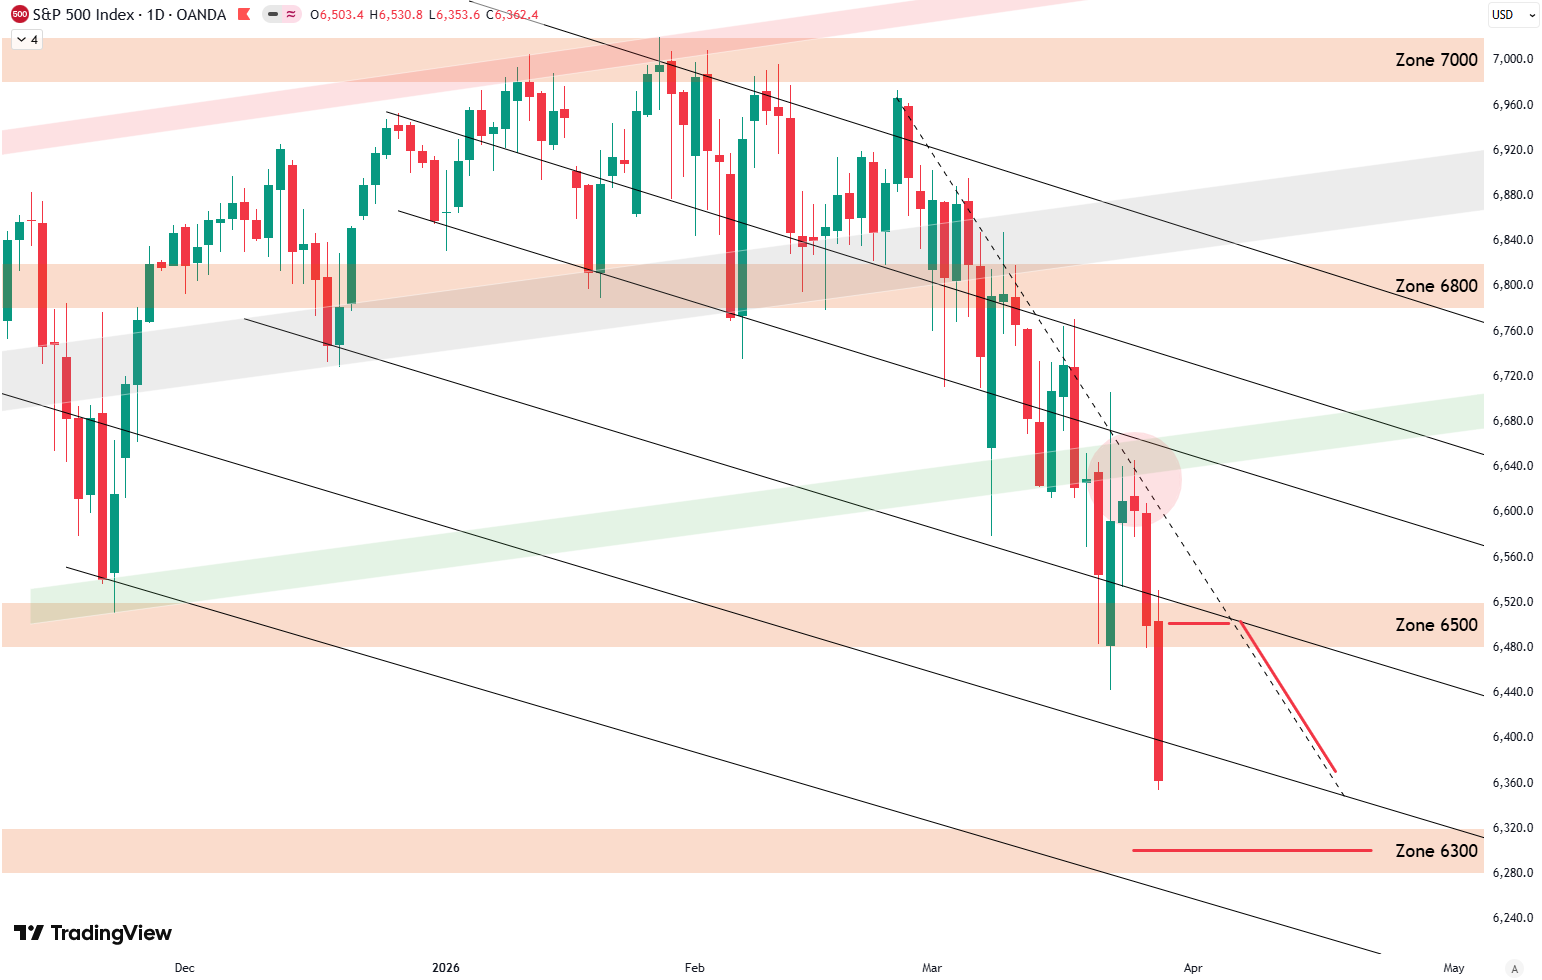
- The 6500 zone broke to the downside, with 6300 as the next strong support.
- The 6500 zone now acts as strong resistance.
- A retest and rejection at the green trendline triggered acceleration to the downside (red circle on the chart).
- The dashed black trendline is expected to act as resistance on any move higher.
- Oversold conditions on the daily timeframe point to a potential bounce.
Daily Technicals (Next Week)
Levels marked in red on the chart.
Black dashed trendline is now the line in the sand.
- Bullish at 6300
- Bearish at black dashed trendline and 6500
Short Term Risk (Next 12 Weeks)
- No signal this week
- We expect new buy signals to trigger once a bottom is established.
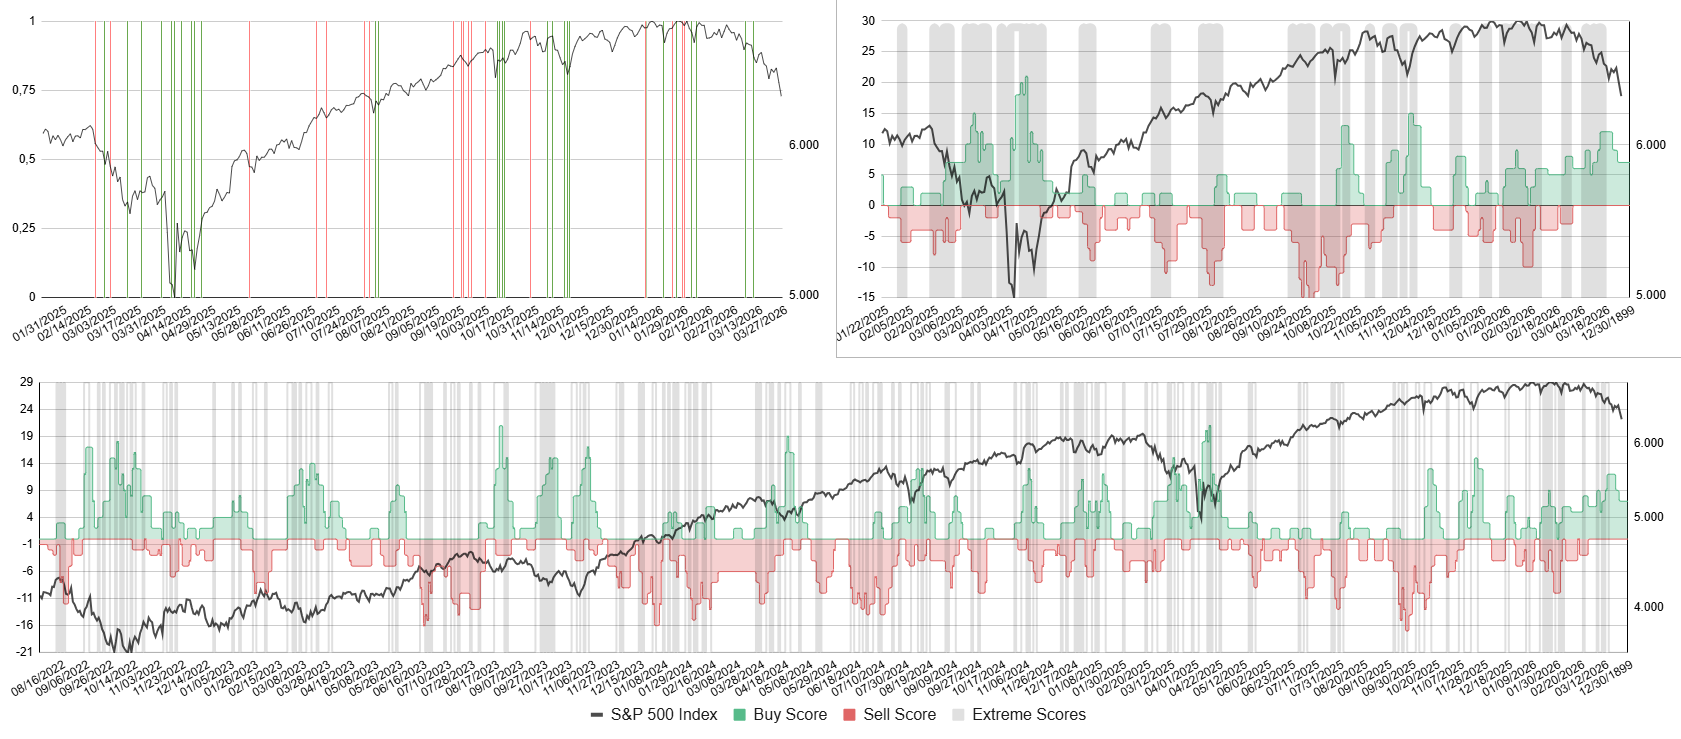
Bottom: Buy score in green, sell score in red, S&P 500 in black.
Top right: Zoomed in version. Top left: Buy and sell signals as vertical lines.
Sign up with your email for free to receive buy and sell signals as soon as they occur:
Mid Term Risk (Next 3-9 Month)
Very Low Risk | Low Risk | Elevated Risk | Very High Risk
- No change.
- The mid-term risk indicator remains in an elevated risk regime.
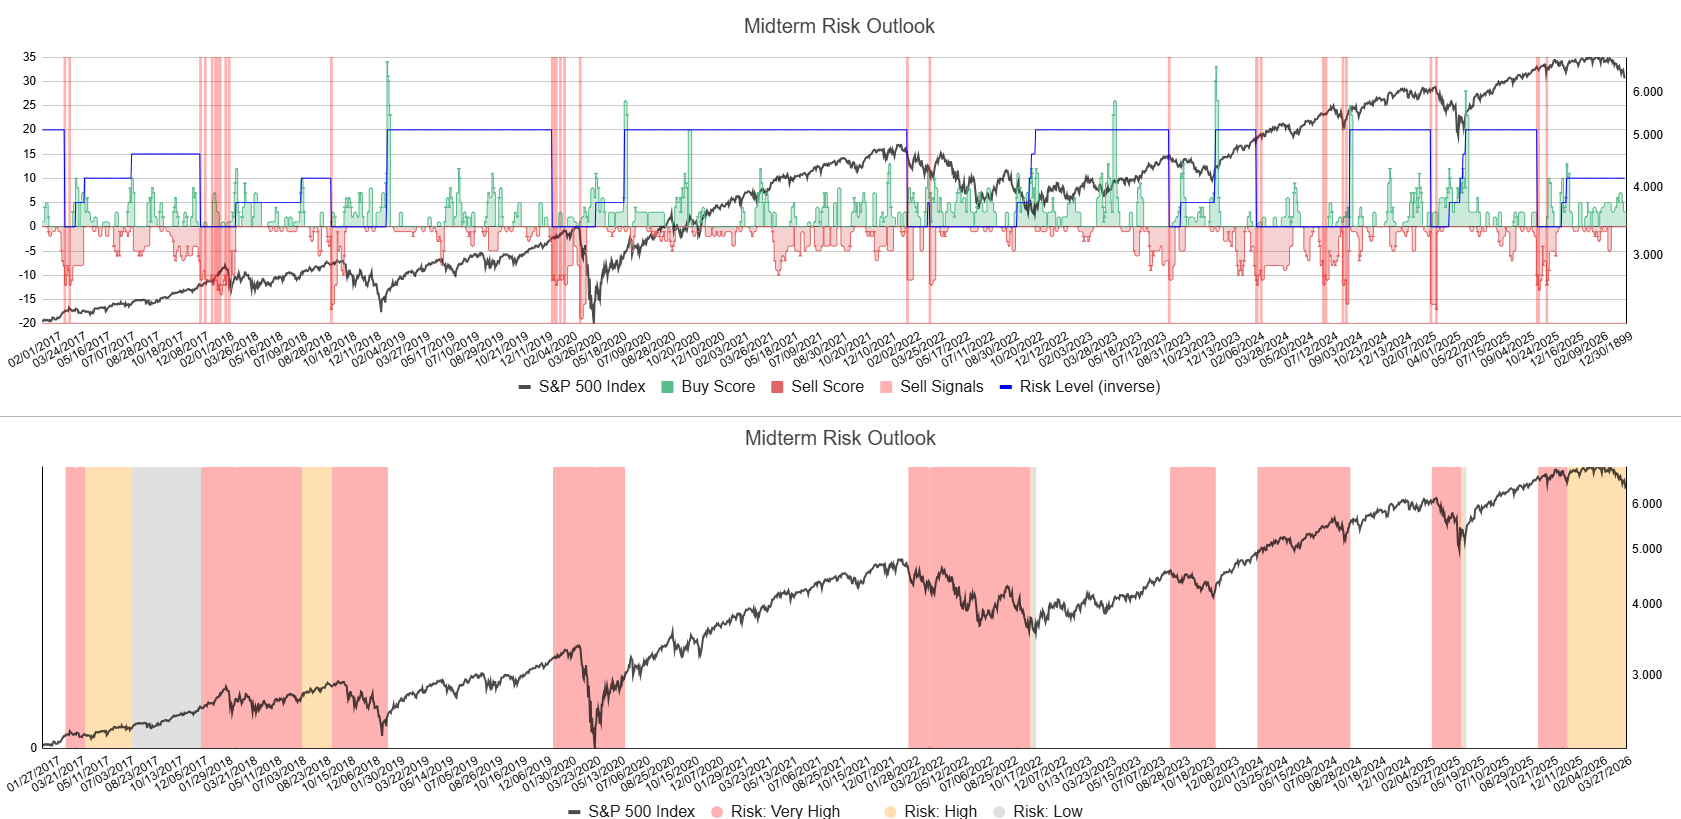
Top: Indicator with internal signals determining risk levels.
Bottom: S&P 500 in black with risk regimes ranging from very low to very high (white, grey, orange and red shaded areas).
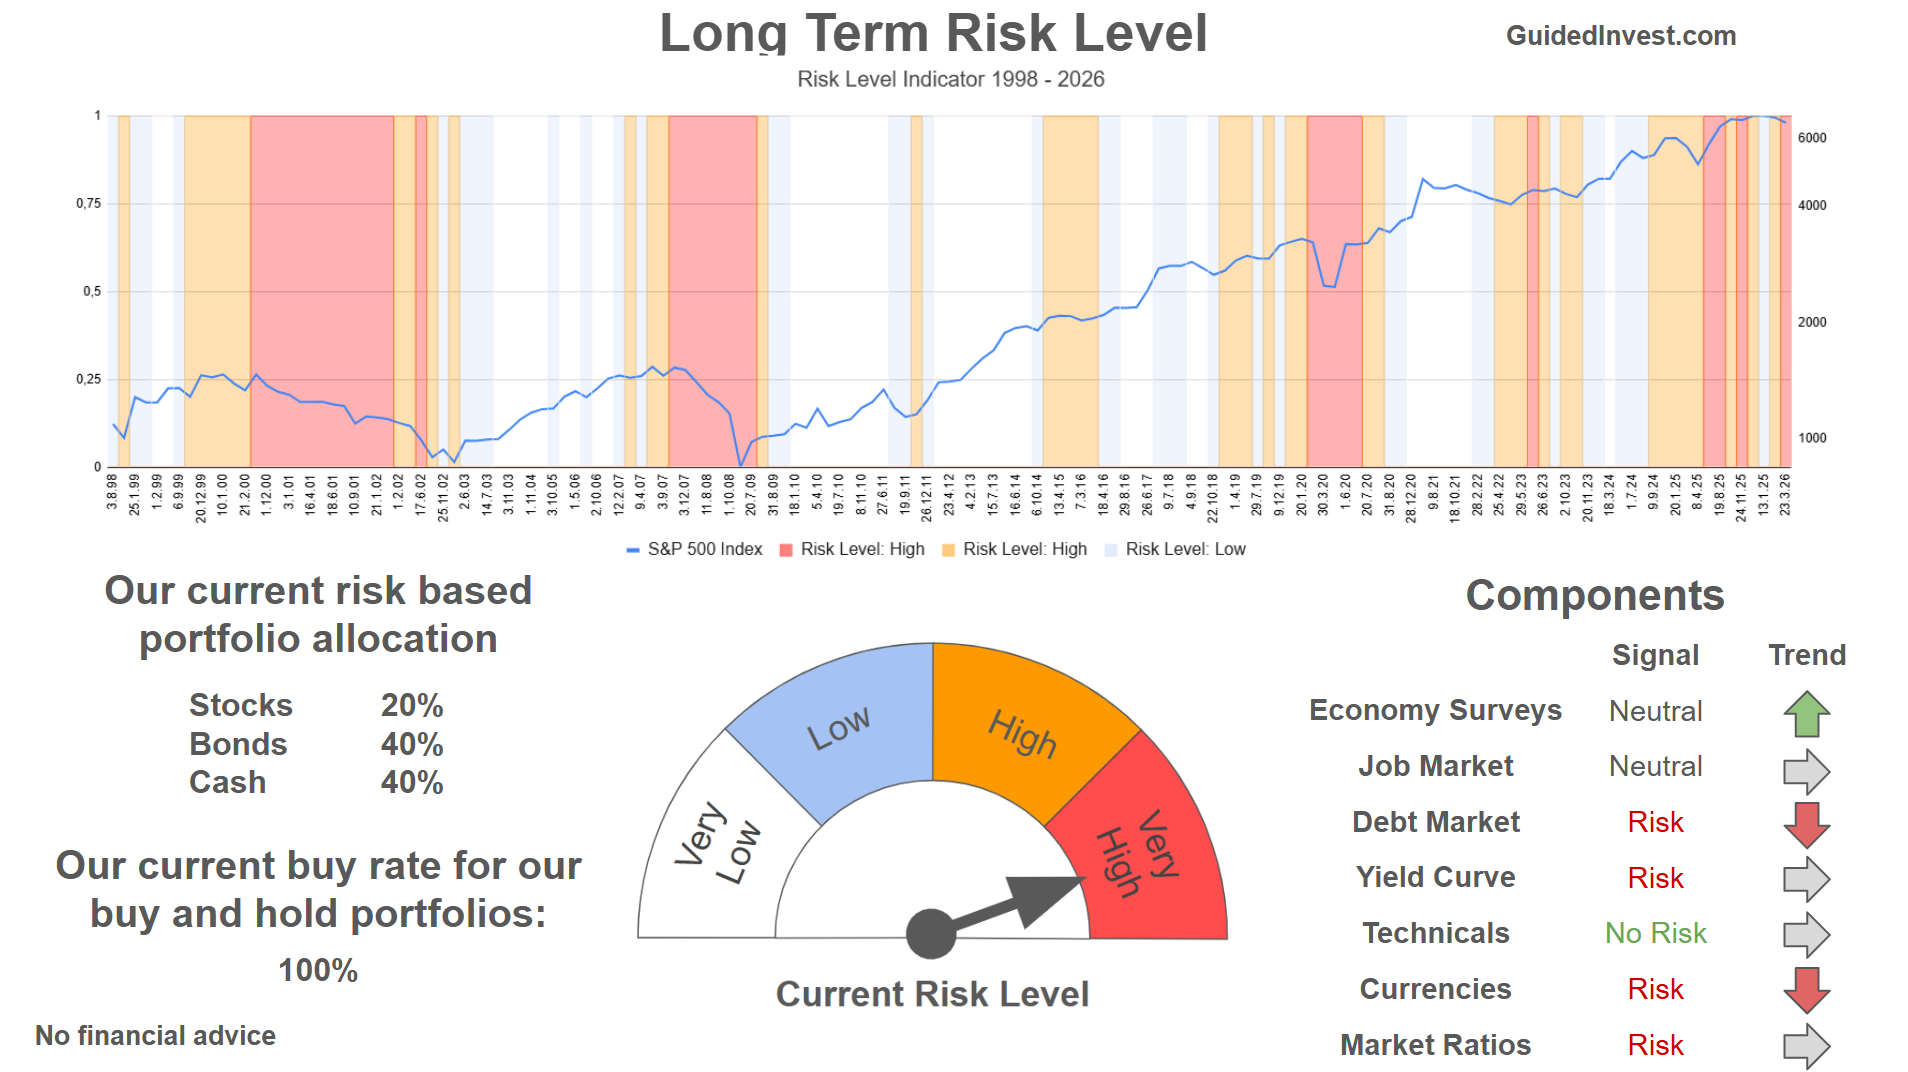
Long Term Risk (Next 9-18 Month)
Very Low Risk | Low Risk | High Risk | Very High Risk
- Risk level change.
- The long term risk indicator shifted from high to very high risk in March 2026.
Seasonality
Sideways for first Quarter.
- No change.
- Seasonality suggest bottom in March and a pick up into April.

Dashboard
All information summarized in our dashboard:
Stay ahead of the market! Sign up for our weekly updates and get additional expert insights on the S&P 500, key support levels, and market trends.
Leave a Reply