
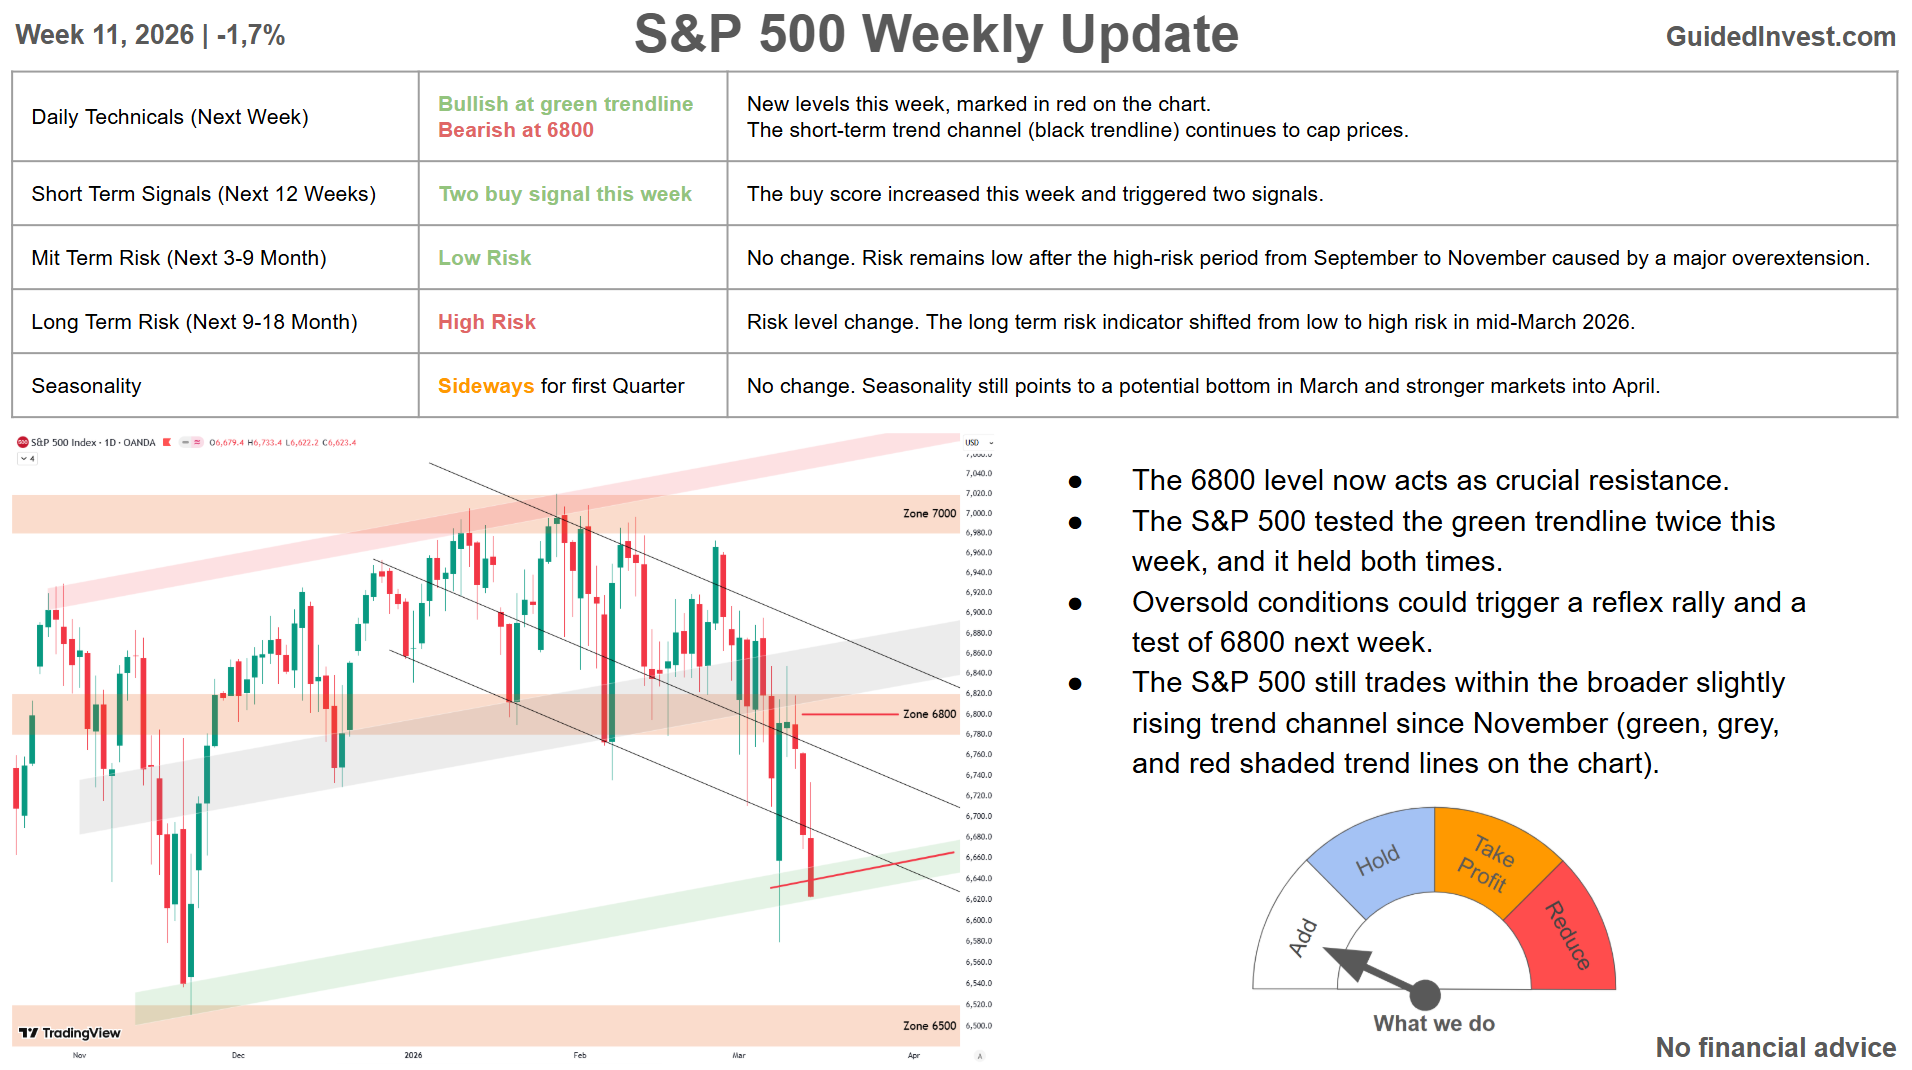
Week 11, 2026 | -1,7%
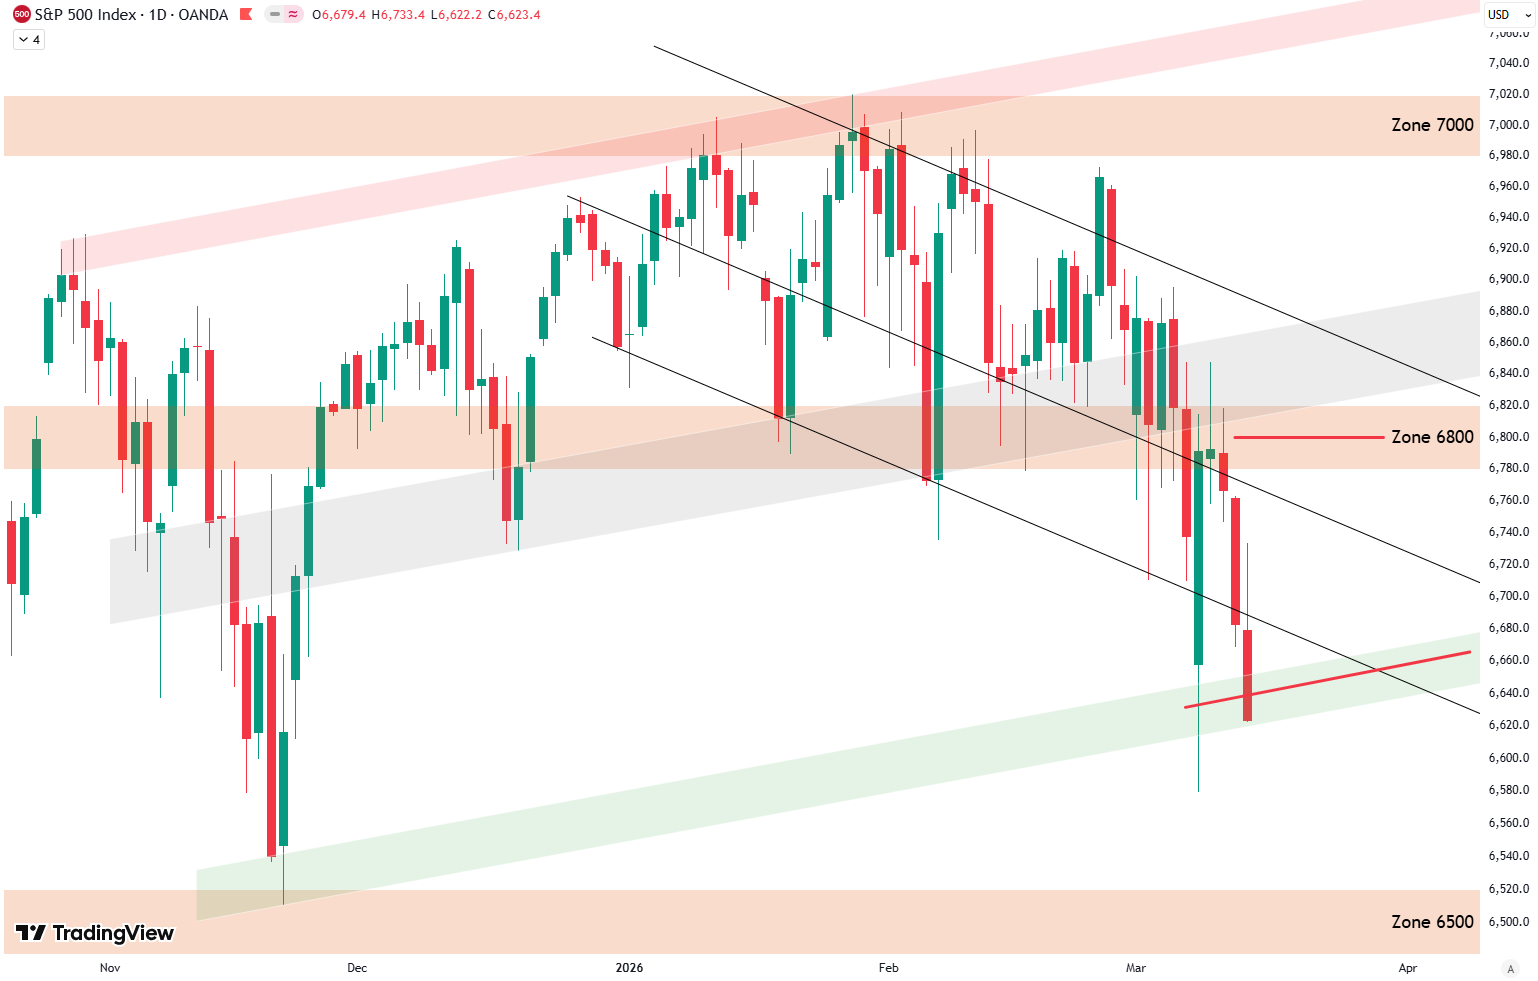
- The 6800 level now acts as crucial resistance.
- The S&P 500 tested the green trendline twice this week, and it held both times.
- Oversold conditions could trigger a reflex rally and a test of 6800 next week.
- The S&P 500 still trades within the broader slightly rising trend channel since November (green, grey, and red shaded trend lines on the chart).
Daily Technicals (Next Week)
Levels marked in red on the chart.
The green shaded trendline acts as the price floor.
- Bullish at green trendline
- Bearish at 6800
Short Term Risk (Next 12 Weeks)
- Two buy signals this week
- The buy score increased this week and triggered two signals.
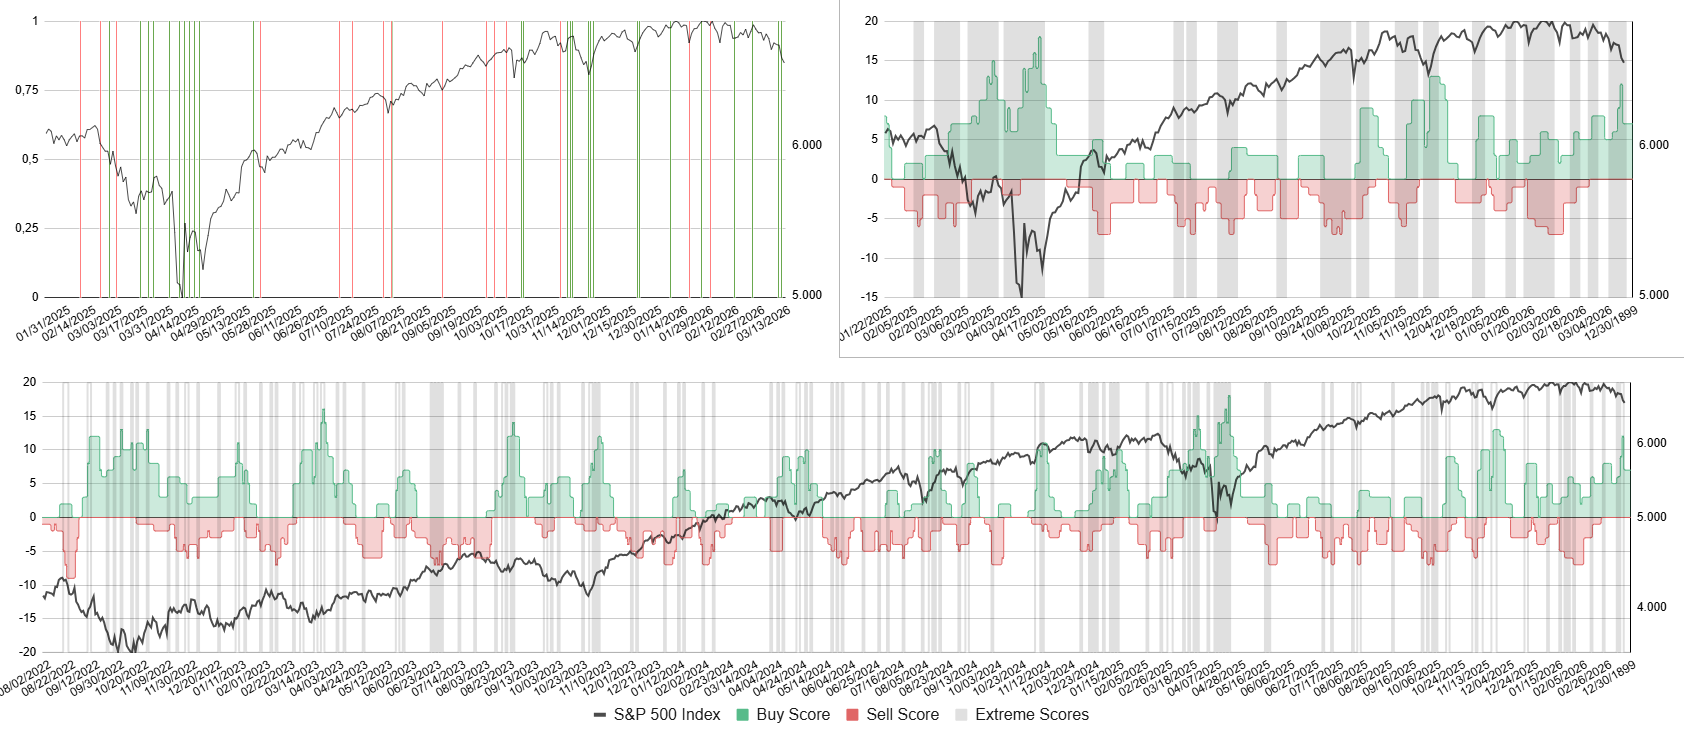
Bottom: Buy score in green, sell score in red, S&P 500 in black.
Top right: Zoomed in version. Top left: Buy and sell signals as vertical lines.
Sign up with your email for free to receive buy and sell signals as soon as they occur:
Mid Term Risk (Next 3-9 Month)
Very Low Risk | Low Risk | High Risk | Very High Risk
- No change.
- Risk remains low after the high-risk period from September to November caused by a major overextension.
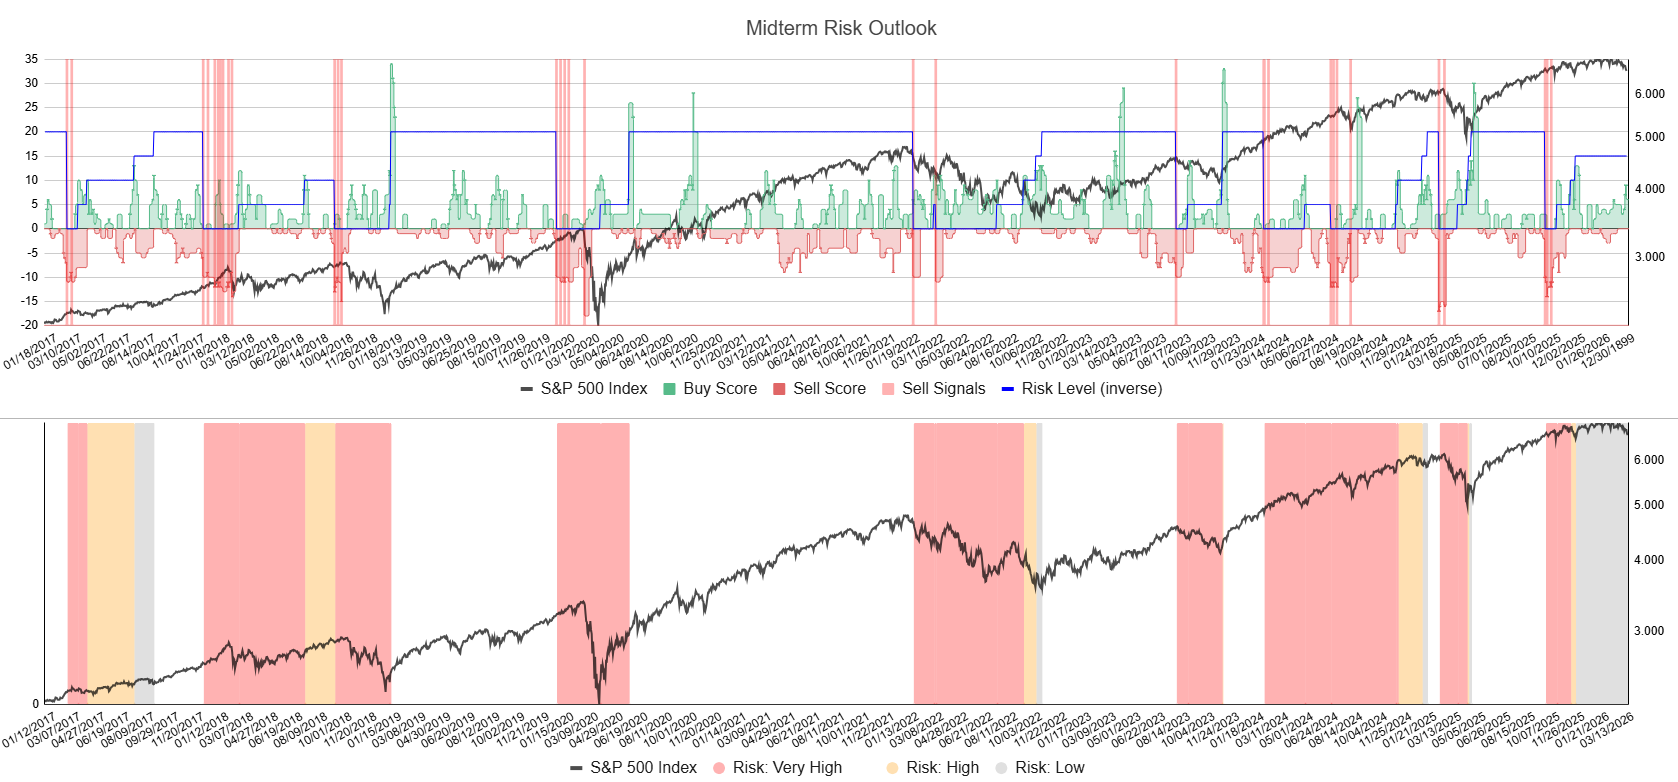
Top: Indicator with internal signals determining risk levels.
Bottom: S&P 500 in black with risk regimes ranging from very low to very high (white, grey, orange and red shaded areas).
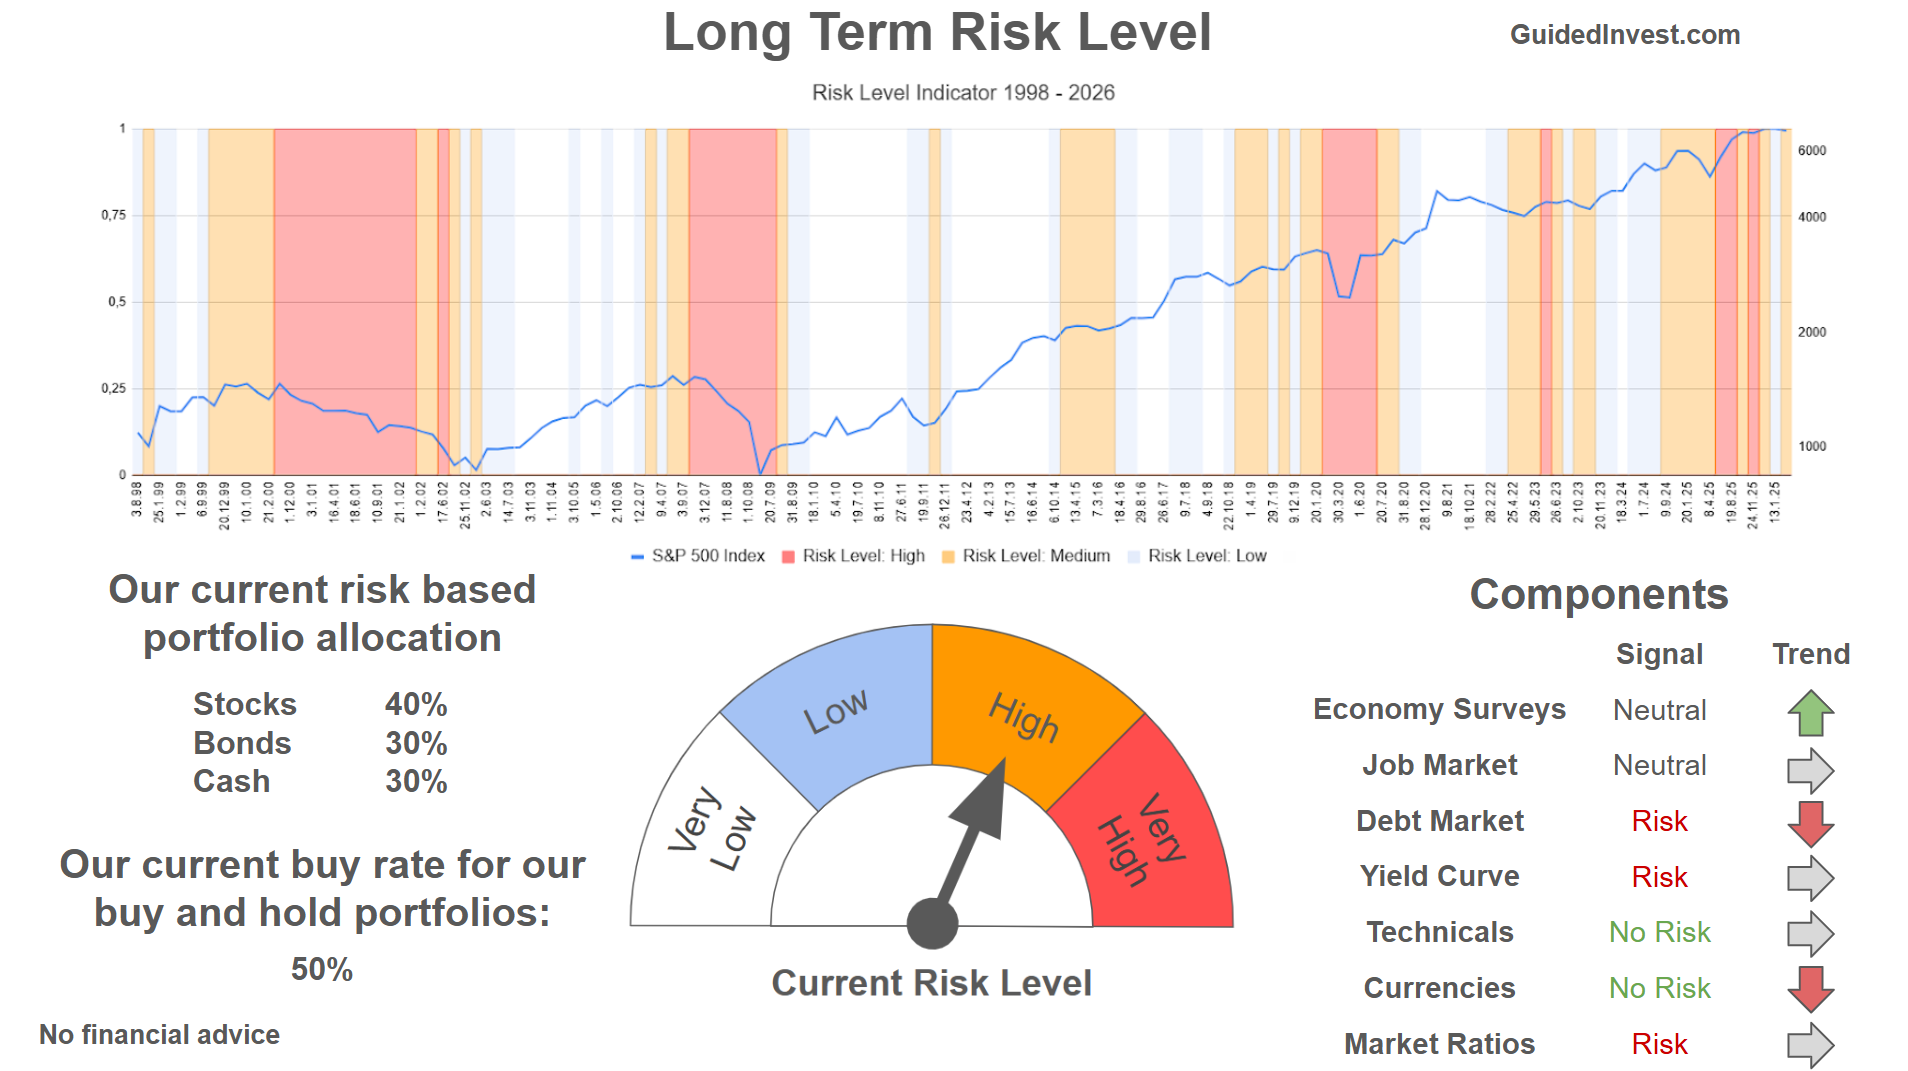
Long Term Risk (Next 9-18 Month)
Very Low Risk | Low Risk | High Risk | Very High Risk
- Risk level change.
- The long term risk indicator shifted from low to high risk in mid-March 2026.
Seasonality
Sideways for first Quarter.
- No change.
- Seasonality suggest bottom in March and a pick up into April.

Dashboard
All information summarized in our dashboard:
Stay ahead of the market! Sign up for our weekly updates and get additional expert insights on the S&P 500, key support levels, and market trends.
Leave a Reply