

Week 10, 2026 | -1,9%
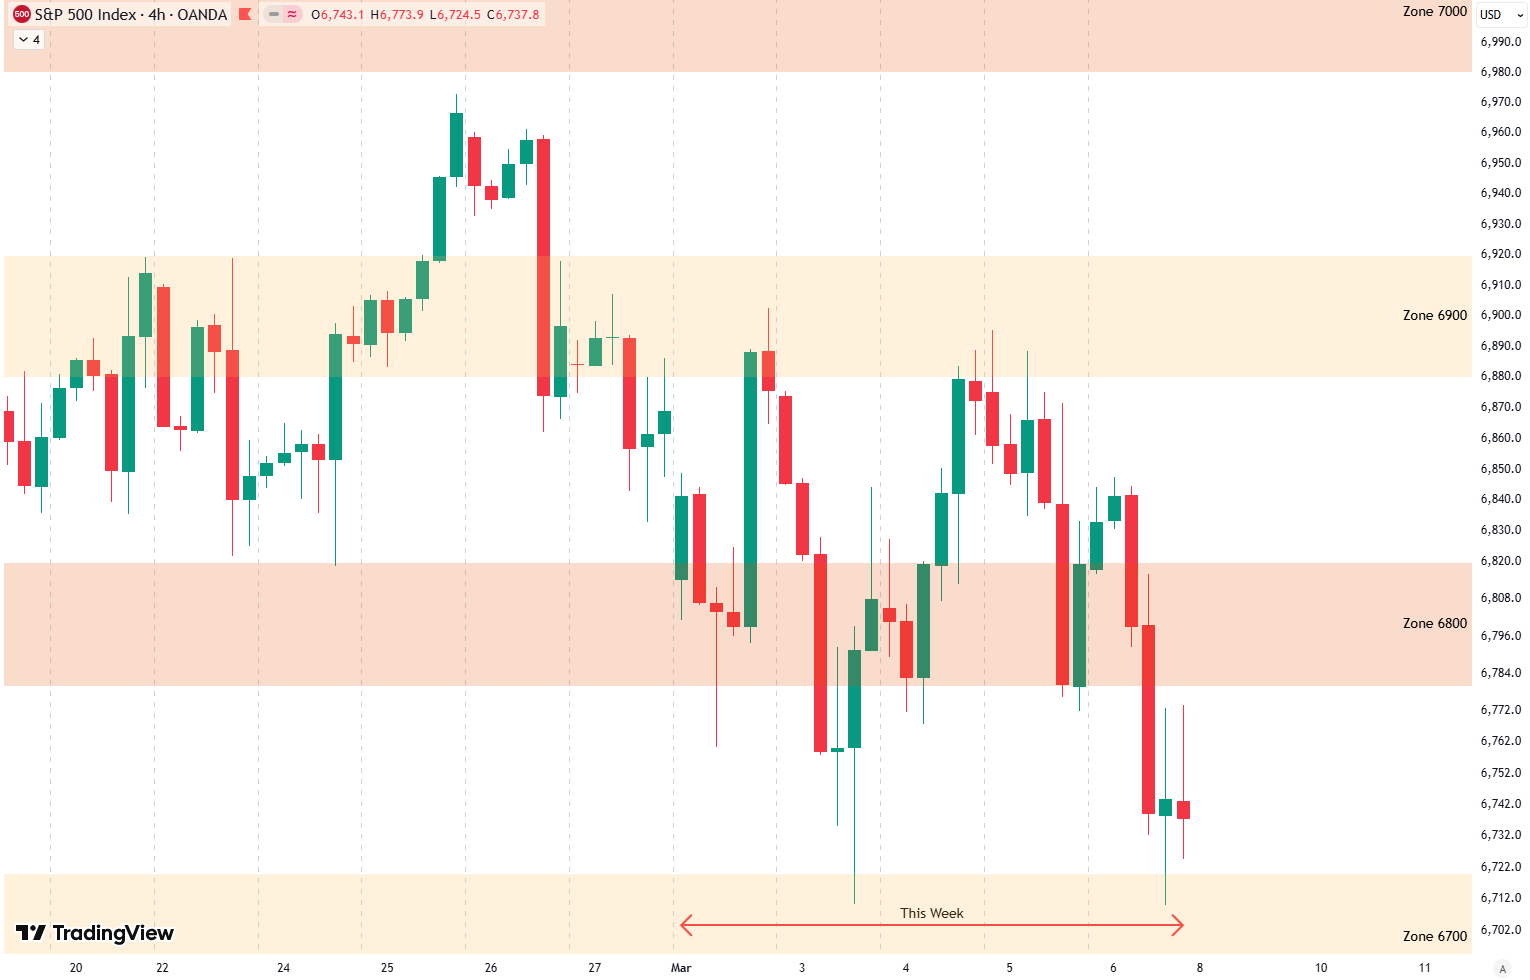
- The 6800 support zone finally broke on Friday.
- The S&P 500 fell below the grey shaded trendline for the first time since November.
- Short-term downside pressure remains in place (black trend lines).
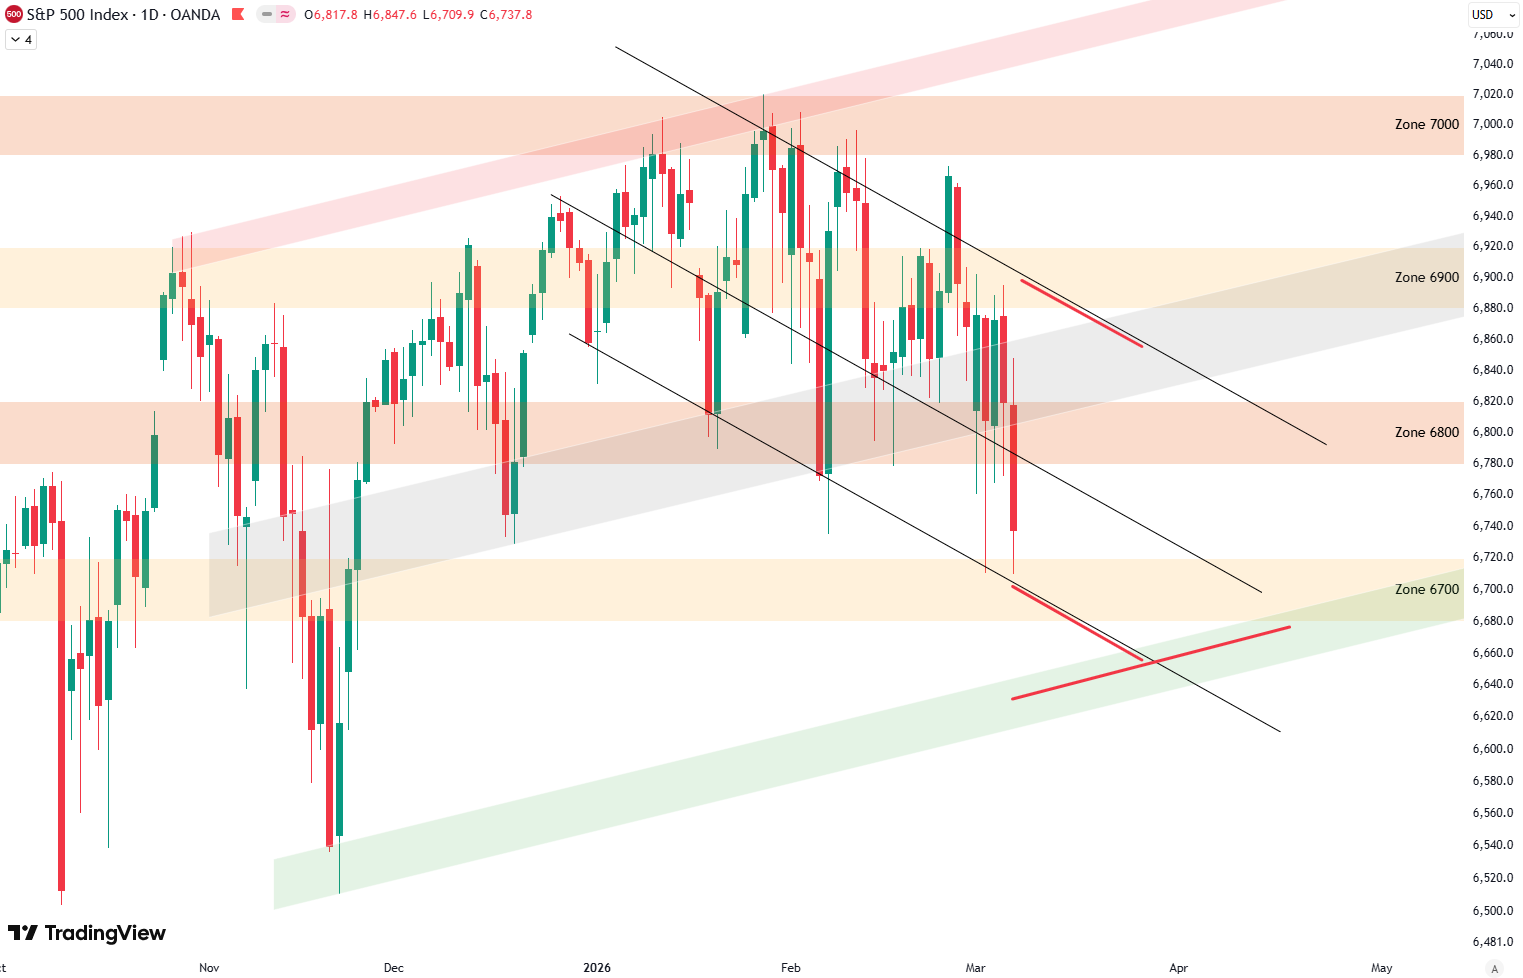
- The S&P 500 still trades within the broader slightly rising trend channel since November (green, grey, and red shaded trend lines on the chart).
Daily Technicals (Next Week)
Bullish at lower black and green trendline
Bearish at upper black trendline
New levels this week, marked in red on the chart.
The short-term trend channel (black trendline) continues to cap prices.
Short Term Risk (Next 12 Weeks)
No signal this week
A very low sell score and a declining buy score leave room for new signals.
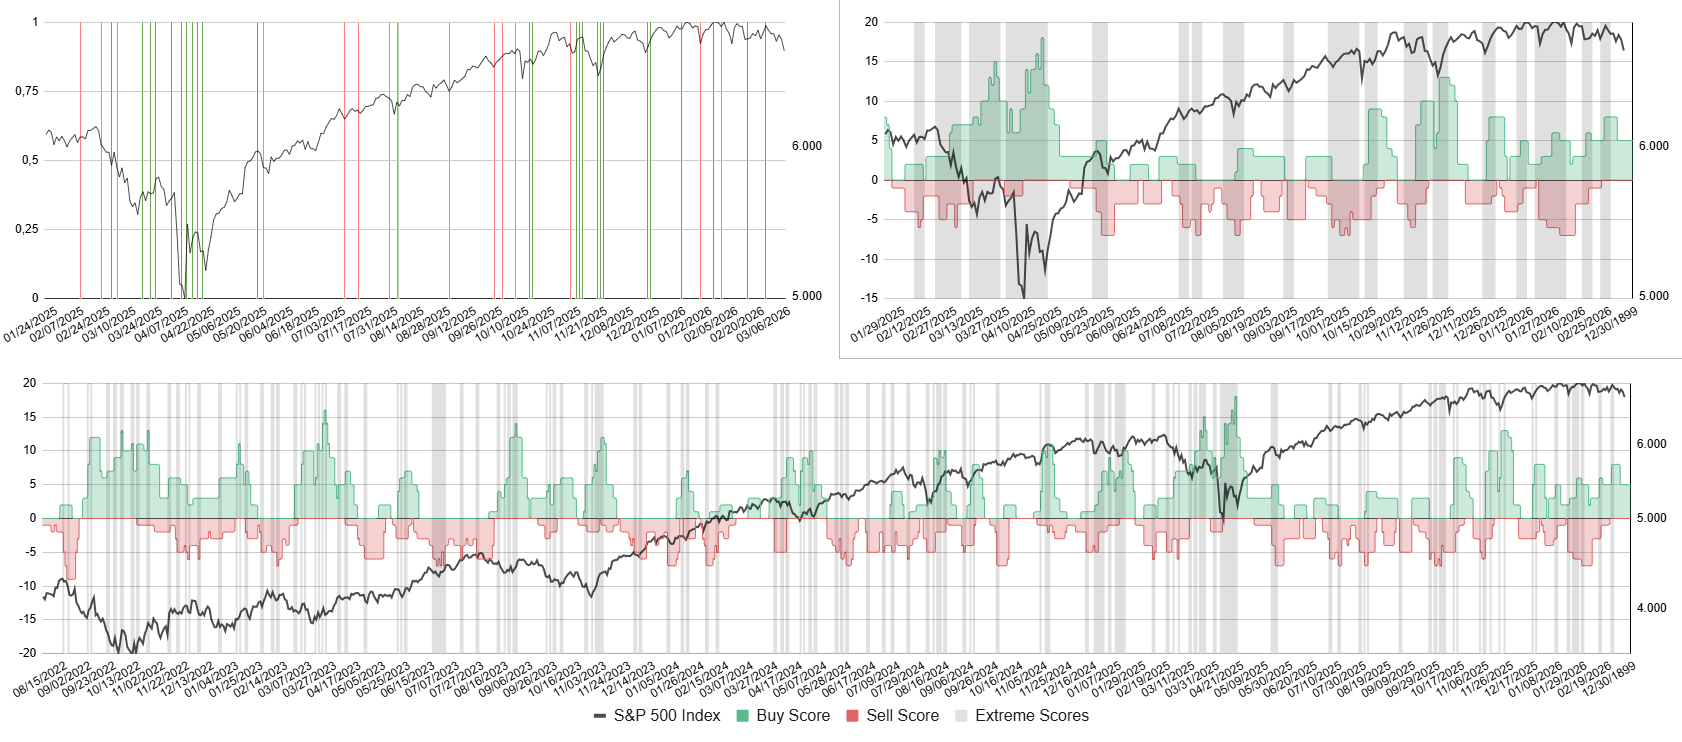
Bottom: Buy score in green, sell score in red, S&P 500 in black.
Top right: Zoomed in version. Top left: Buy and sell signals as vertical lines.
Sign up with your email for free to receive buy and sell signals as soon as they occur:
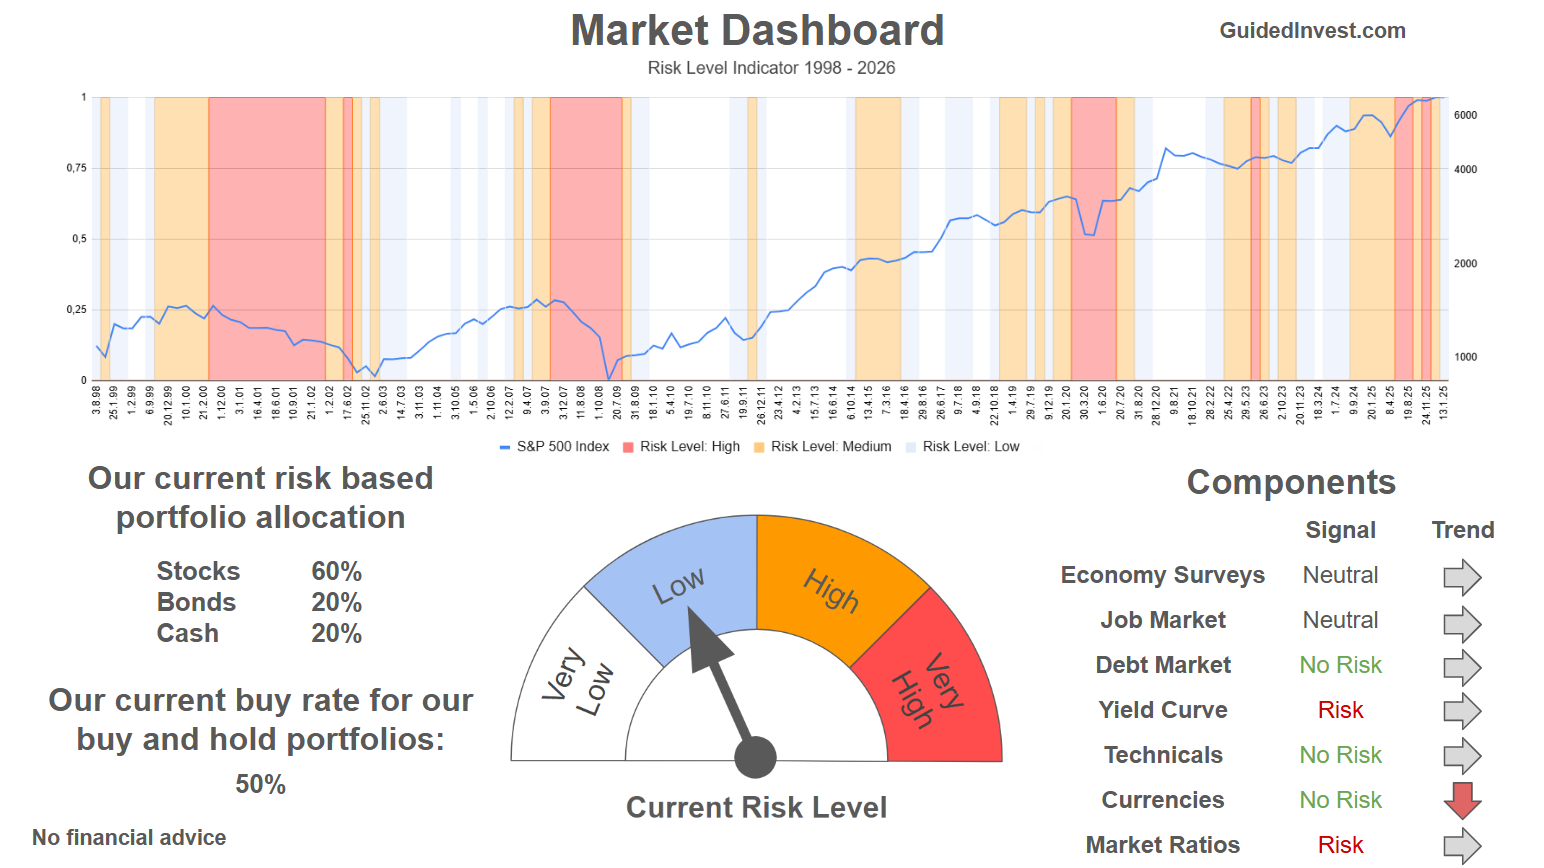
Mid Term Risk (Next 3-9 Month)
Very Low Risk | Low Risk | High Risk | Very High Risk
No change
Risk remains low after the high-risk period from September to November caused by a major overextension.
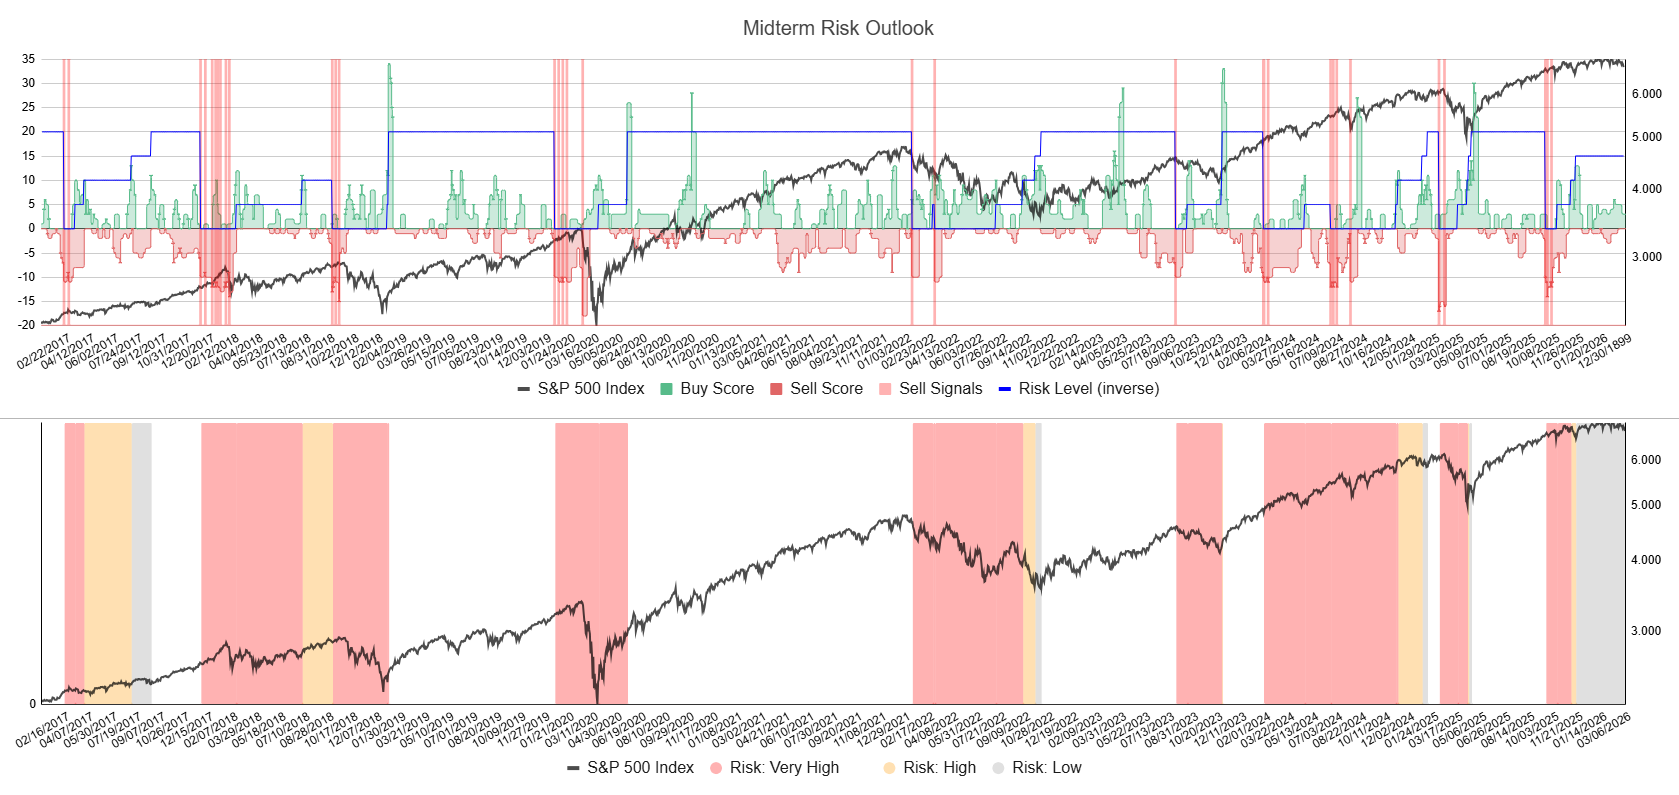
Top: Indicator with internal signals determining risk levels.
Bottom: S&P 500 in black with risk regimes ranging from very low to very high (white, grey, orange and red shaded areas).
Long Term Risk (Next 9-18 Month)
Very Low Risk | Low Risk | High Risk | Very High Risk
No change.
Still in Low Risk, after High Risk leading into -20% drawdown in April 2025 (Link).
Seasonality
Sideways for first Quarter.
No change.
Seasonality suggest bottom in March and a pick up into April.

Stay ahead of the market! Sign up for our weekly updates and get additional expert insights on the S&P 500, key support levels, and market trends.
Leave a Reply