
Welcome to our weekly newsletter on the S&P 500. This week was tough—really tough. The S&P 500 lost around 9%, with the index dropping nearly 11% since Wednesday alone. That’s one of the steepest and fastest moves we’ve seen in quite some time.
So, what happened? New tariffs were announced midweek. That triggered a rapid repricing in the markets as investors adjusted to changing expectations for earnings and future growth. You could feel the fear in the price action.
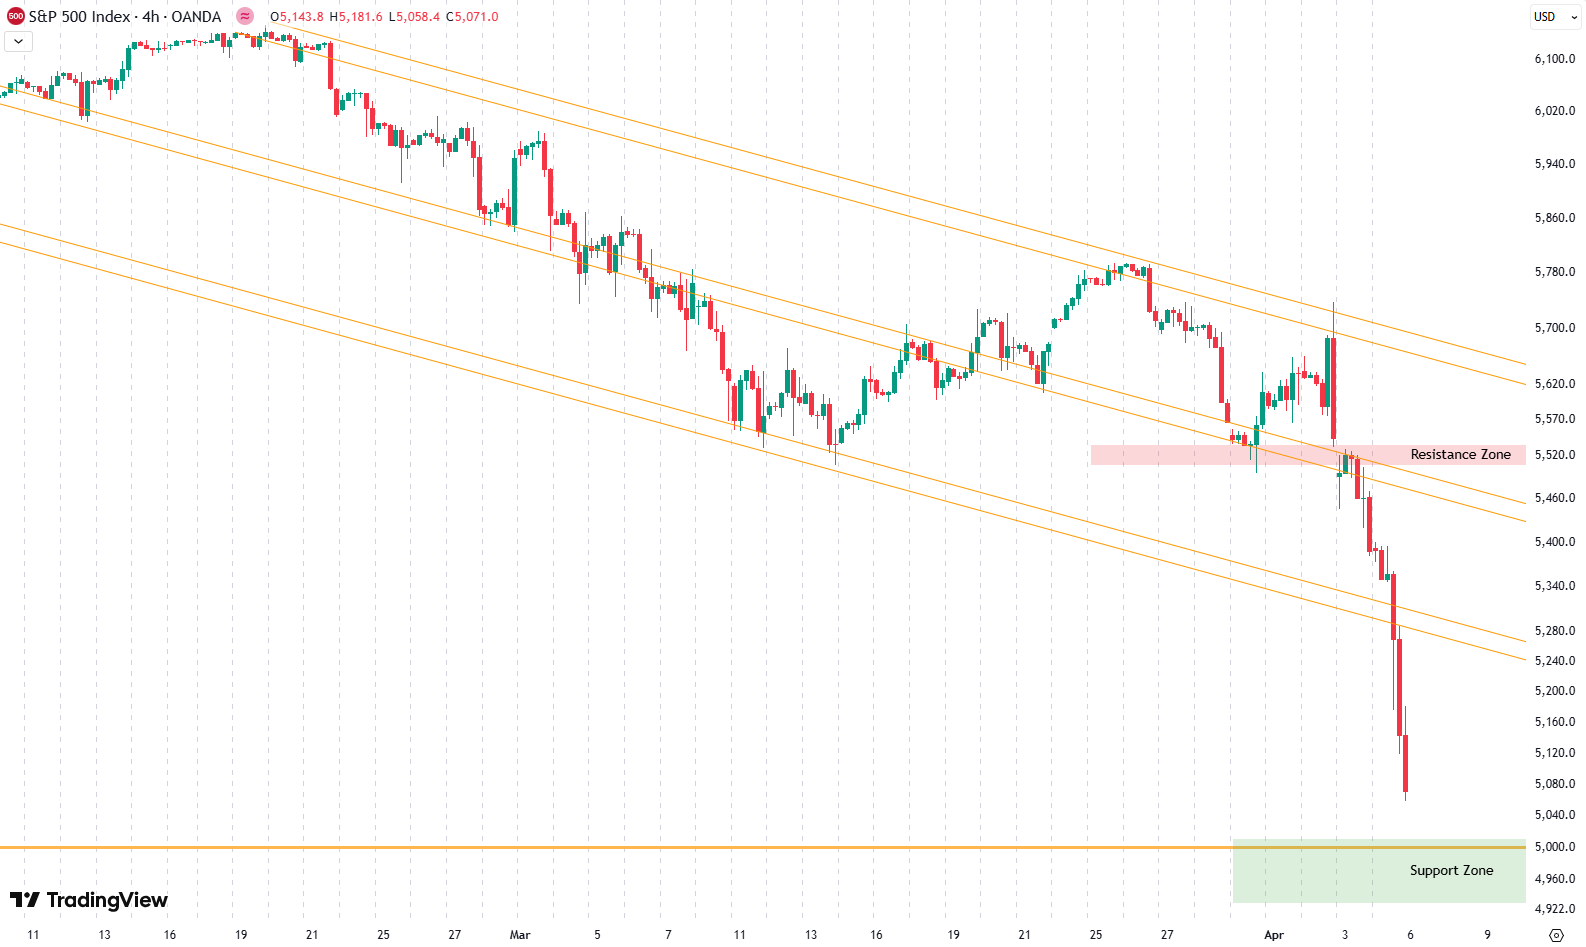
If you look at the 4-hour chart, it’s all laid out clearly. Since the top in February, we’ve been stuck inside a steeply declining trend channel, marked by the orange trend lines. And then Friday happened. We decisively dropped out of that already sharp channel—accelerating the move even more.
This kind of momentum can shake out a lot of investors, but it’s also part of a larger story that’s still unfolding. Keep an eye on the chart—what comes next might matter even more.
Our last position, which we placed on March 17th, has been active until March 31th, when we sold it for a loss.
Are you wondering when to buy the S&P 500 as an investor? Join our community of smart do-it-yourself investors who are making informed decisions with our expert insights, just by signing up with your email!
Premium Guide
Advanced Investing Signals
Basic Guide
Basic Investing
Signals
Simple Guide
Selected
Signals
Get started today with our free financial guide! Just enter your email, and you’ll start receiving our most popular Simple Guide with exclusive market signals right in your inbox.
S&P Falls Through Floor
Looking at the daily chart, the story continues. That same orange trend channel we’ve been watching has now been broken—decisively. The support zone we talked about last week didn’t hold long. Prices sliced right through it during this week’s rapid sell-off.
Now we’re heading for the next key level: the 5000-point mark. You can see this clearly on the chart with the green “support zone” box. It’s a significant psychological level, and we’ve often said that these big round numbers tend to pull prices in like magnets.
At the same time, RSI is sitting deep in oversold territory, and prices are trading well below the lower daily Bollinger Band. Historically, that setup often signals that a bounce or relief rally could be around the corner. It’s not a guarantee, but something to watch for if we reach that green zone.
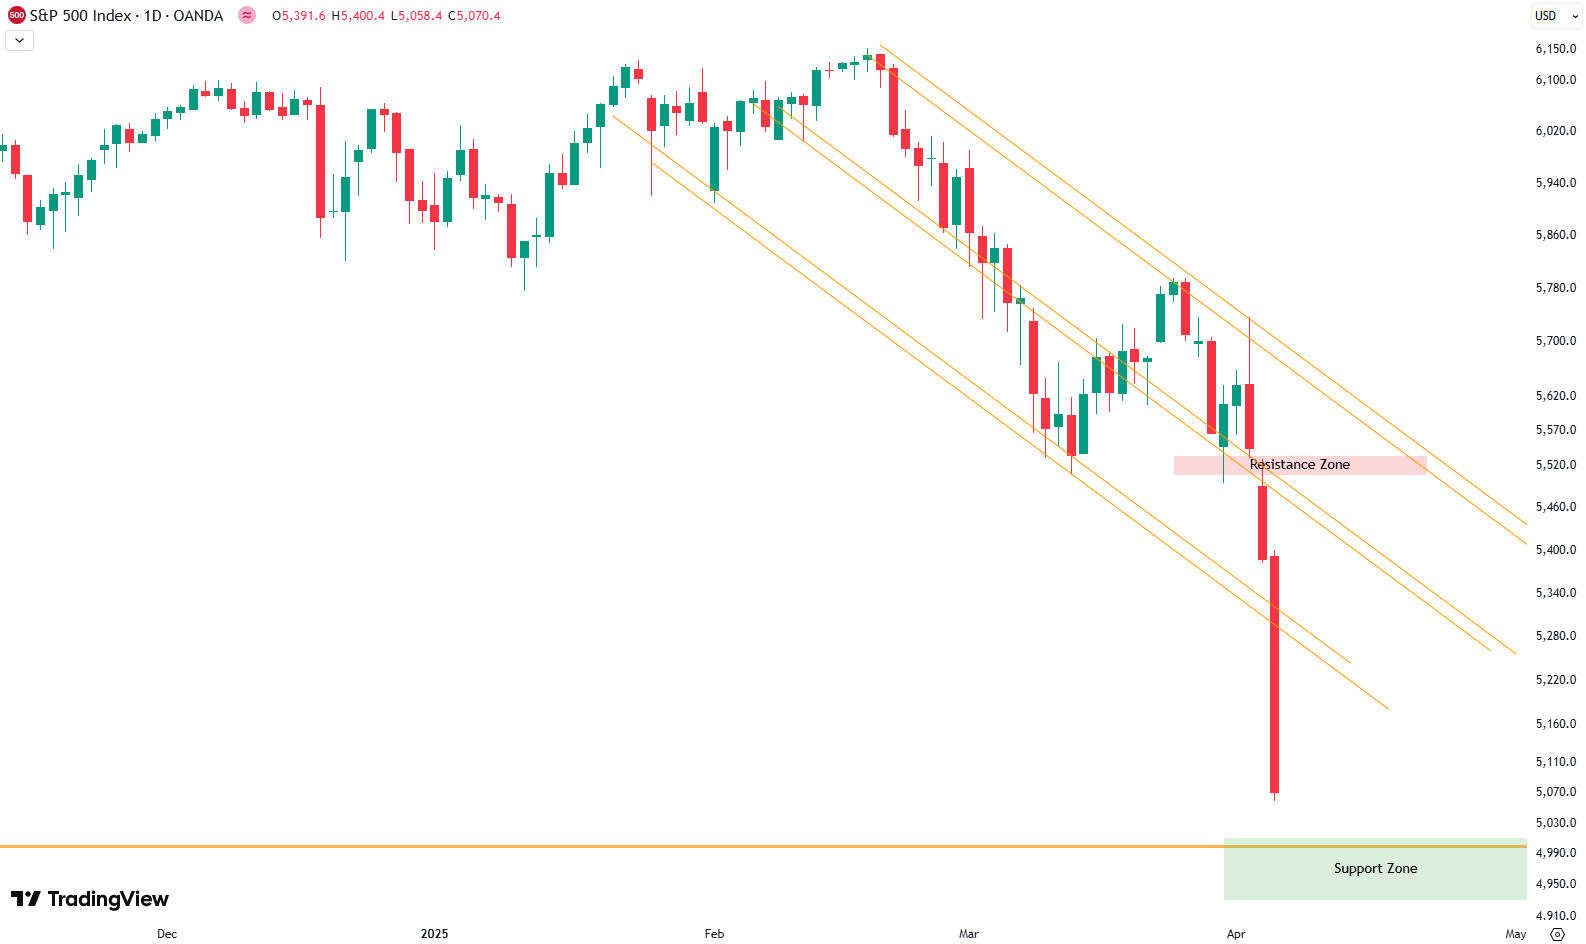
But even if we get a rally, don’t expect a V-shaped recovery. The S&P 500 has now broken far below its 200-day moving average. That’s a red flag for a deeper and more prolonged correction. Patience is key here. This kind of correction can take time—maybe months, maybe quarters.
It’s a waiting game now. If we reach that green box area near 5000, a tradable rally might happen. But longer term? We could still go lower before things truly stabilize.
Let’s zoom out. The weekly chart gives us a more complete picture of where we might be headed.
Each candle here represents one week of price action. Since the low in October 2022, the S&P 500 had been climbing in a rising trend channel. But this week’s drop finally broke us out of that channel. That shorter-term structure is now broken and no longer valid.
What’s more important now is the broader trend channel. That one includes a gray shaded midline area—and we just broke below that too. You can see the red circle on the chart marking that moment. When this happens, we usually look to the next zones below.
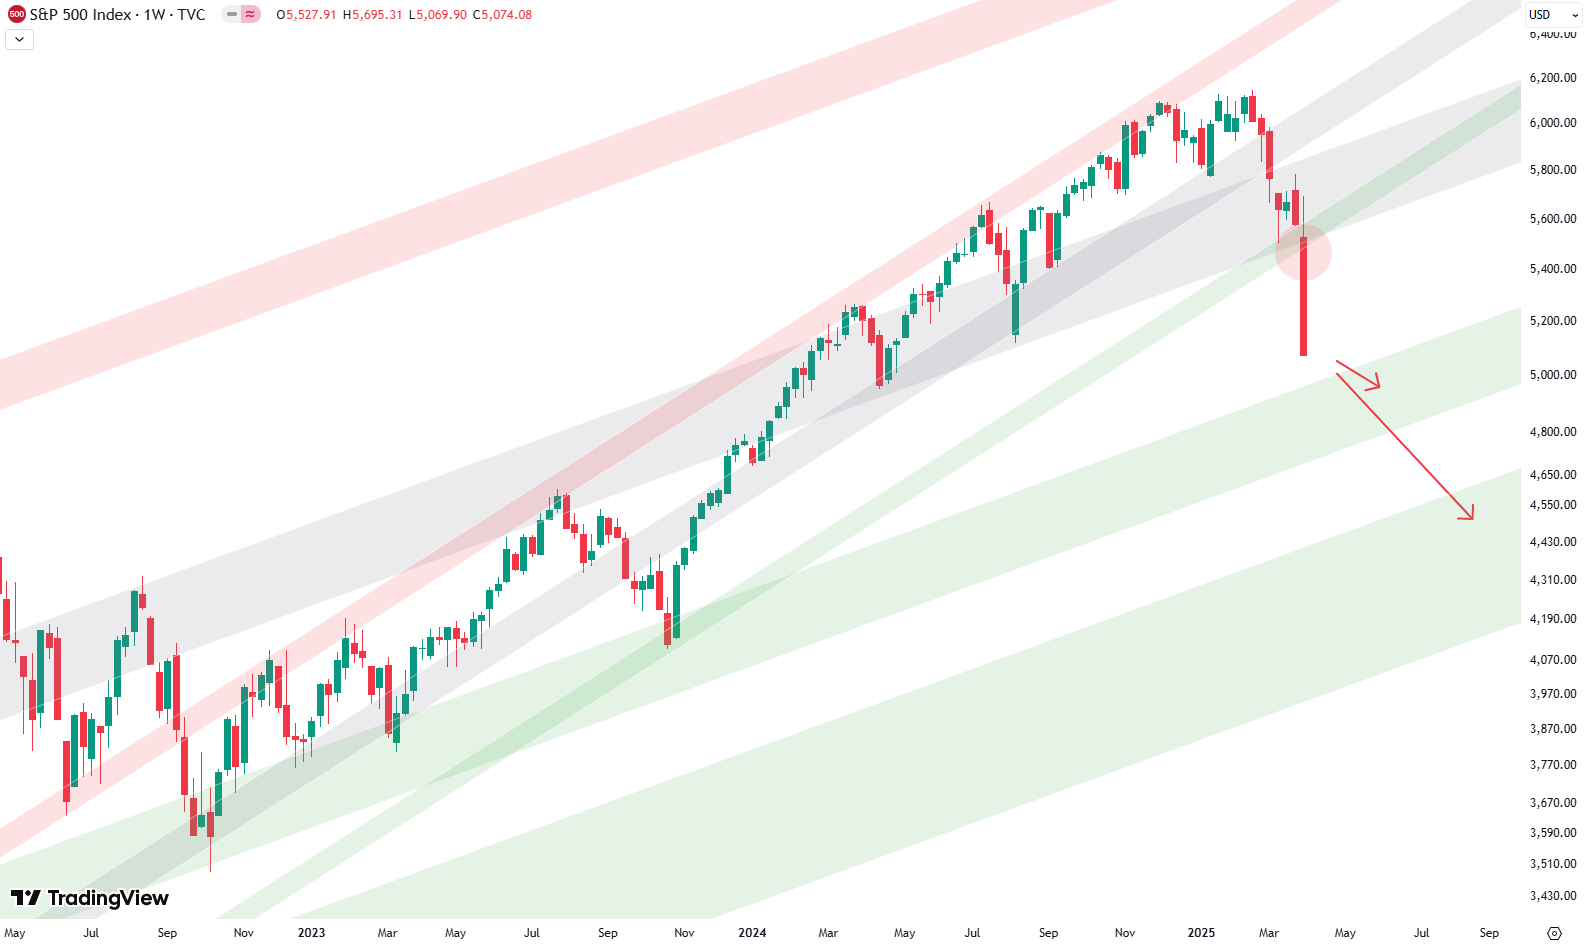
That brings us to the green shaded support zones. The upper green area is not far away now—we could reach it soon. But if this correction keeps stretching out, it’s very possible we’ll test the lower green zone, which lies about another 10% beneath current prices. Two red arrows on the chart outline these paths.
Some short-term relief rallies are likely along the way. But make no mistake, we’re in a corrective phase, and it could take time to fully play out.
Many investors may be sitting on losses right now. The speed of the drop didn’t leave much time to react. But for anyone looking to invest, this is the kind of setup you wait for—pullbacks of 10% or more give you a real shot at buying quality stocks at better prices. These moments aren’t fun, but they’re necessary.
For subscribers it is very important to follow our risk management measures that we provide with all our services to protect against losses in case support zones break
Stay ahead of the market! Sign up for our weekly updates and get expert insights on the S&P 500, key support levels, and market trends.
S&P 500: Seasonality Insights for Early 2025
Seasonality charts often provide helpful context for understanding market tendencies. Historically, the S&P 500 exhibits a choppy start to the year, with January and February experiencing turbulence that can extend into mid-March. This seasonal pattern suggests the potential for weakness in the coming weeks.
However, this type of analysis should always be approached cautiously. While seasonal trends indicate broad expectations, they cannot predict the future. Notably, last year saw significant deviations from typical patterns, with strength in the market that outpaced historical norms.
If seasonality holds true, this early choppiness might be followed by stabilization. Still, after the notable price increases seen in late 2024, investors should prepare for possible volatility and ensure proper risk management strategies are in place.
Ultimately, seasonal trends provide valuable context, but they must be considered alongside current market dynamics and technical analysis for a clearer picture. The S&P 500’s behavior during this critical time will reveal whether the seasonal weakness manifests or if the market defies expectations again.

Track Market Risk with Our Dashboard
Our Market Dashboard provides a quick overview of the current market conditions and, more importantly, the associated risk. You can view a chart of one of our tools, the Risk Level Indicator, showing predicted risk from 1998 to 2024. If you are interested, you can visit our Dashboard site here.

The world of finance is complex and includes many technical terms. For explanations of these terms, I recommend using the Investopedia dictionary.
Leave a Reply