
Hello everyone! This week was another eventful one for the S&P 500. Looking at the 4-hour chart, we can see some major market movements. The week kicked off with a sharp drop of 1.8% at the open on Monday, meaning the market opened significantly lower than Friday’s close. However, what happened next was impressive: the market rallied strongly throughout the day, recovering nearly all losses by the close.
Following Monday’s recovery, we saw smaller pullbacks during the week, but overall, the S&P 500 continued to show strength. However, Friday saw a sell-off, hinting at possible weakness ahead. Despite this, the market managed to close the week almost where it started, which, given the initial drop, signals resilience.
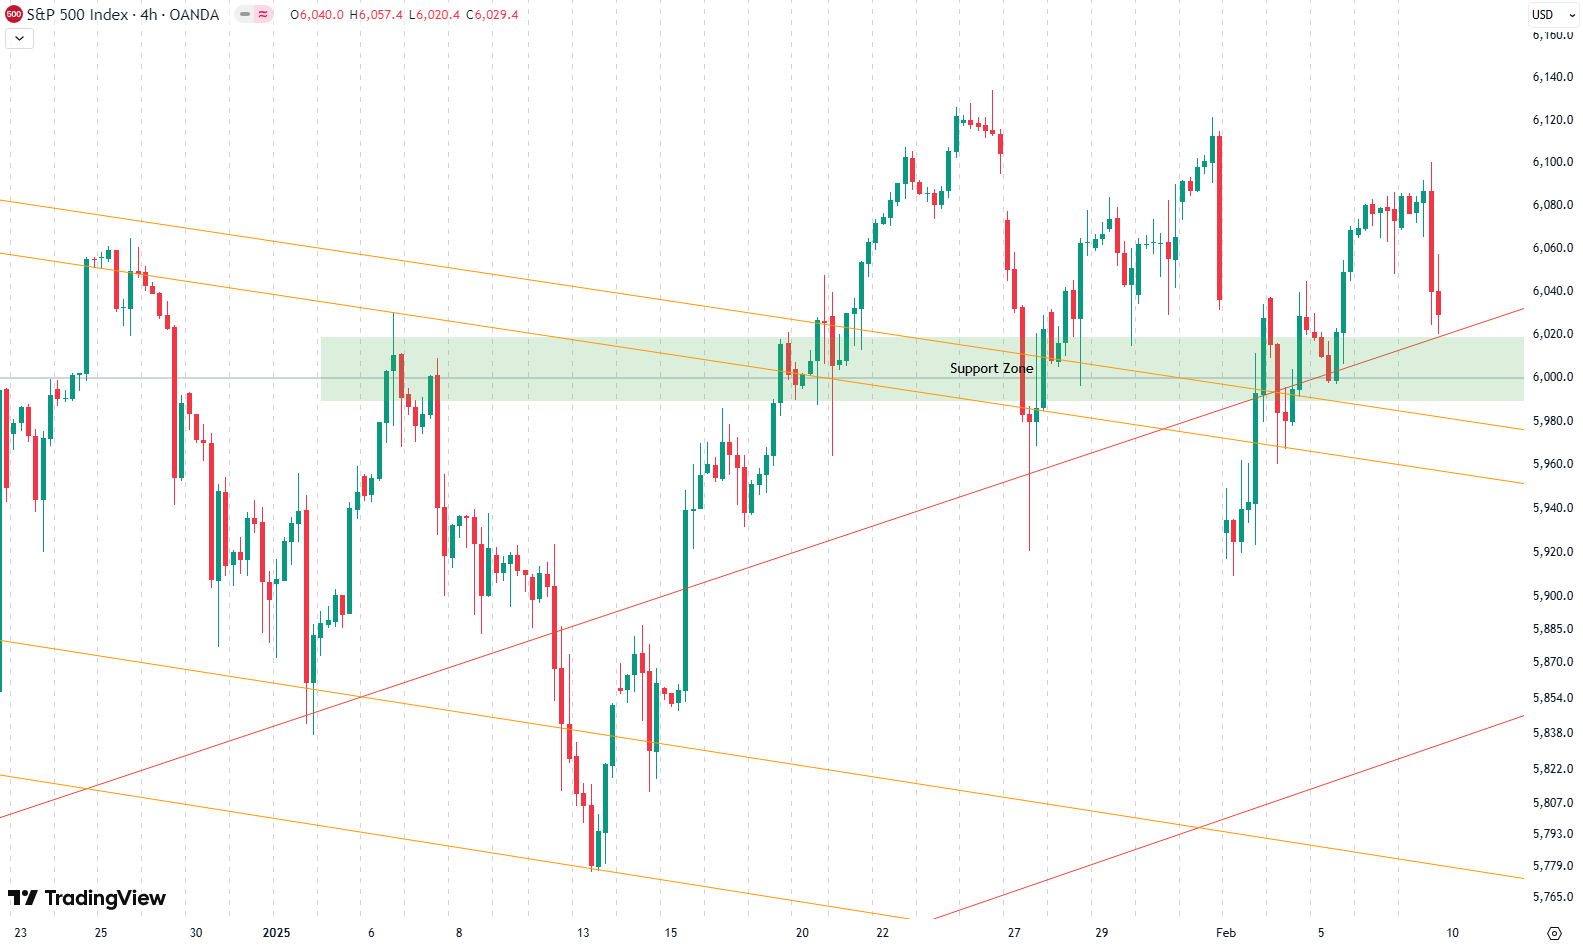
Looking at the 4-hour chart, we can see a consolidation phase over the last two to three weeks, staying above the crucial 6,000-point level. This level is significant, as the market tested previous highs from late December and early January, now turning them into support. The ability to hold above these levels suggests strength, but we need further confirmation in the coming days.
Our last position, which we placed on November 20, has been active until December 10, when we sold it for a gain of 5.7%
Are you wondering when to buy the S&P 500 as an investor? Join our community of smart do-it-yourself investors who are making informed decisions with our expert insights, just by signing up with your email!
Premium Guide
Advanced Investing Signals
Basic Guide
Basic Investing
Signals
Simple Guide
Selected
Signals
Get started today with our free financial guide! Just enter your email, and you’ll start receiving our most popular Simple Guide with exclusive market signals right in your inbox.
Breakout or Top Forming?
Looking at the daily chart, the strength of this week becomes even clearer. The S&P 500 opened the week below several key support levels—the 6,000-point mark, the green support zone, and trendlines from both the weekly and daily charts. Yet, Monday saw a strong push upward, reclaiming all those levels. By Tuesday, there was a retest of support (visible by the long wick on the red candle), followed by further gains throughout the week. This bounce from support levels suggests that buyers remain in control, making further upside likely.

One key concern, however, is the lack of decisive new highs. When comparing the tops from November, December, and now January, the market isn’t making strong new highs, creating what looks like a rounding top formation. If we push higher but fail to make a significant new high, it could indicate underlying weakness. The strong support hold is only meaningful if we see follow-through in the form of a breakout. Otherwise, this could be part of a broader topping pattern.
The critical level remains 6,000 points. If the market breaks below this level decisively, it would signal potential downside risk. Until then, the trend remains cautiously bullish, but a strong move higher is needed to confirm continued strength.
For subscribers, it is very important to follow our risk management measures that we provide with all our services to protect against losses in case support zones break. Get full access to our insights by simply entering your email. Having these updates delivered straight to your inbox ensures you never miss crucial market movements.
S&P 500: Seasonality Insights for Early 2025
Seasonality charts often provide helpful context for understanding market tendencies. Historically, the S&P 500 exhibits a choppy start to the year, with January and February experiencing turbulence that can extend into mid-March. This seasonal pattern suggests the potential for weakness in the coming weeks.
However, this type of analysis should always be approached cautiously. While seasonal trends indicate broad expectations, they cannot predict the future. Notably, last year saw significant deviations from typical patterns, with strength in the market that outpaced historical norms.
If seasonality holds true, this early choppiness might be followed by stabilization. Still, after the notable price increases seen in late 2024, investors should prepare for possible volatility and ensure proper risk management strategies are in place.
Ultimately, seasonal trends provide valuable context, but they must be considered alongside current market dynamics and technical analysis for a clearer picture. The S&P 500’s behavior during this critical time will reveal whether the seasonal weakness manifests or if the market defies expectations again.

Track Market Risk with Our Dashboard
Our Market Dashboard provides a quick overview of the current market conditions and, more importantly, the associated risk. You can view a chart of one of our tools, the Risk Level Indicator, showing predicted risk from 1998 to 2024. If you are interested, you can visit our Dashboard site here.

The world of finance is complex and includes many technical terms. For explanations of these terms, I recommend using the Investopedia dictionary.
Leave a Reply