
Welcome to this week’s S&P 500 newsletter! The week kicked off with strength, delivering some much-needed optimism after a rough prior week. While the S&P 500 ended the previous week with a 2.0% decline, we saw a strong recovery of 3.0% this week. Monday’s rally set the tone, and the momentum carried into Wednesday. For now, all eyes are on how prices respond next week as the index finds itself back at a major resistance point.
Our last position, which we placed on November 20, has been active until December 10, when we sold it for a gain of 5.7%
Are you wondering when to buy the S&P 500 as an investor? Explore our tailored services and join our growing community of do-it-yourself investors who have successfully navigated the market with our guidance.
Premium Guide
Advanced Investing Signals
Basic Guide
Basic Investing
Signals
Simple Guide
Selected
Signals
Congratulations! You’ve discovered your new free financial guide. Simply sign up for our most popular service, our Simple Guide.
Can the Rally Break Resistance?
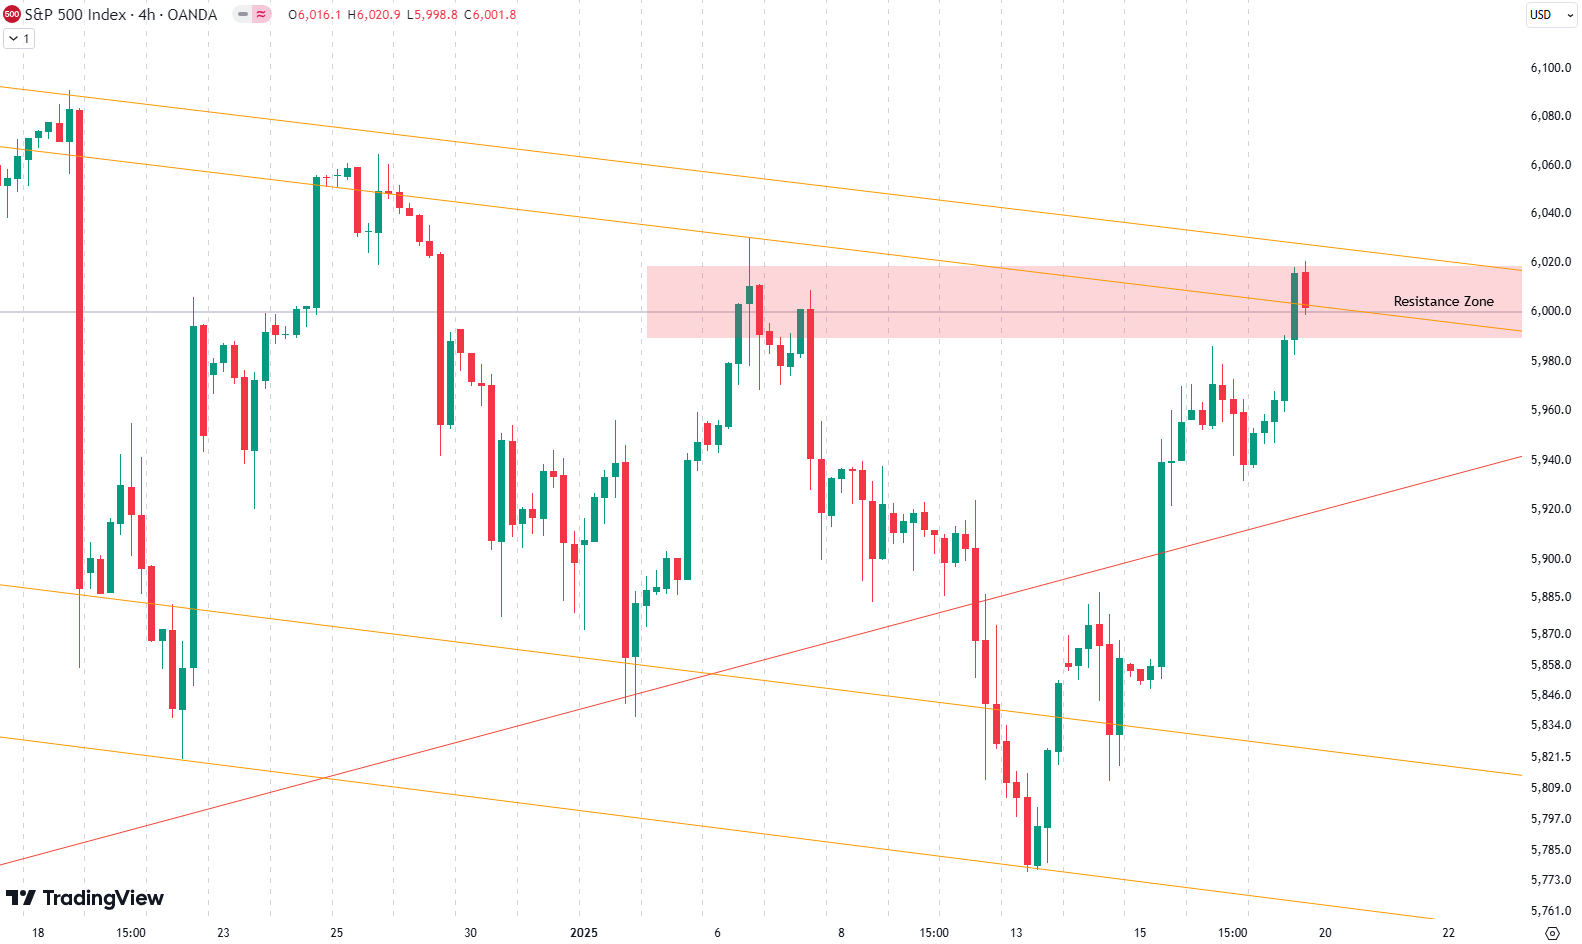
Looking at the daily chart, the market offered a textbook example of technical behavior. Last week, we saw a sharp decline that brought the S&P 500 straight to a crucial support zone defined by downward-sloping orange trendlines. These lines align with an important red trendline on the weekly chart, creating a confluence of support levels. True to form, the index rebounded dramatically from this level.

This week, the rally drove prices directly into a critical resistance zone near 6,000. The red-shaded area on the daily chart marks this horizontal level, combined with the downward-sloping orange trendlines acting as overhead pressure. Breaking through this zone is vital for the S&P 500 to aim for all-time highs.
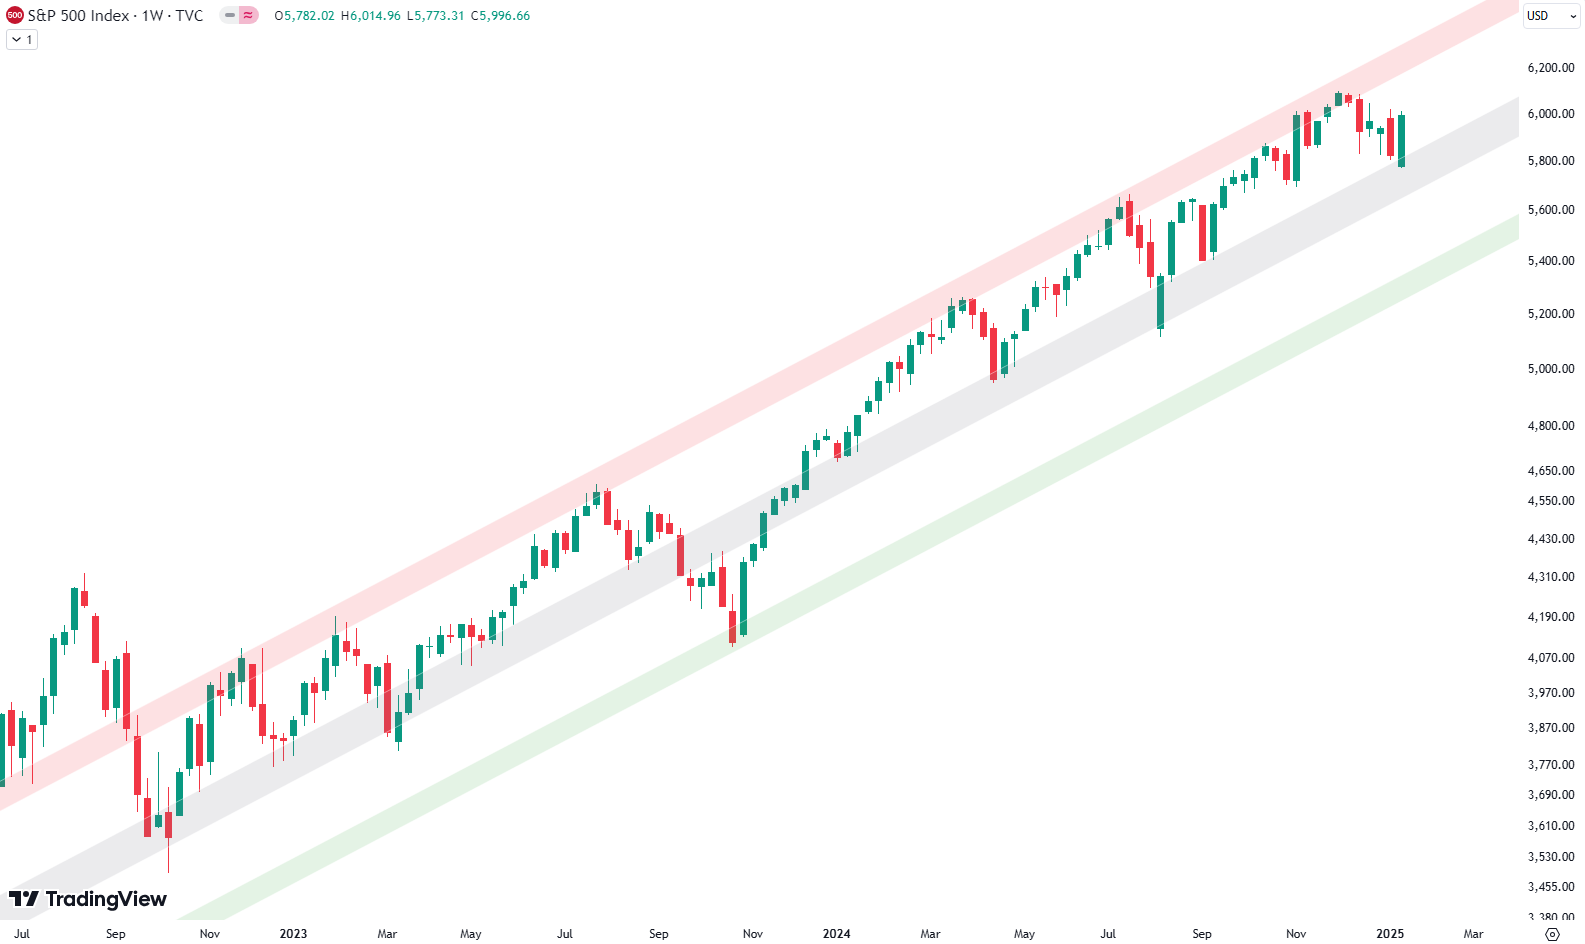
Zooming out to the weekly chart, the bigger picture shows a steady, rising trend channel that dates back to late 2022. Prices dipped into the middle (gray-shaded) area of the channel, which provided support. This clean technical bounce hints at a healthy continuation of the longer-term uptrend. If prices can flip 6,000 from resistance into support, we may see new highs soon.
For subscribers it is very important to follow our risk management measures that we provide with all our services to protect against losses in case support zones break
S&P 500: Seasonality Insights for Early 2025
Seasonality charts often provide helpful context for understanding market tendencies. Historically, the S&P 500 exhibits a choppy start to the year, with January and February experiencing turbulence that can extend into mid-March. This seasonal pattern suggests the potential for weakness in the coming weeks.
However, this type of analysis should always be approached cautiously. While seasonal trends indicate broad expectations, they cannot predict the future. Notably, last year saw significant deviations from typical patterns, with strength in the market that outpaced historical norms.
If seasonality holds true, this early choppiness might be followed by stabilization. Still, after the notable price increases seen in late 2024, investors should prepare for possible volatility and ensure proper risk management strategies are in place.
Ultimately, seasonal trends provide valuable context, but they must be considered alongside current market dynamics and technical analysis for a clearer picture. The S&P 500’s behavior during this critical time will reveal whether the seasonal weakness manifests or if the market defies expectations again.

Track Market Risk with Our Dashboard
Our Market Dashboard provides a quick overview of the current market conditions and, more importantly, the associated risk. You can view a chart of one of our tools, the Risk Level Indicator, showing predicted risk from 1998 to 2024. If you are interested, you can visit our Dashboard site here.

The world of finance is complex and includes many technical terms. For explanations of these terms, I recommend using the Investopedia dictionary.
Leave a Reply