
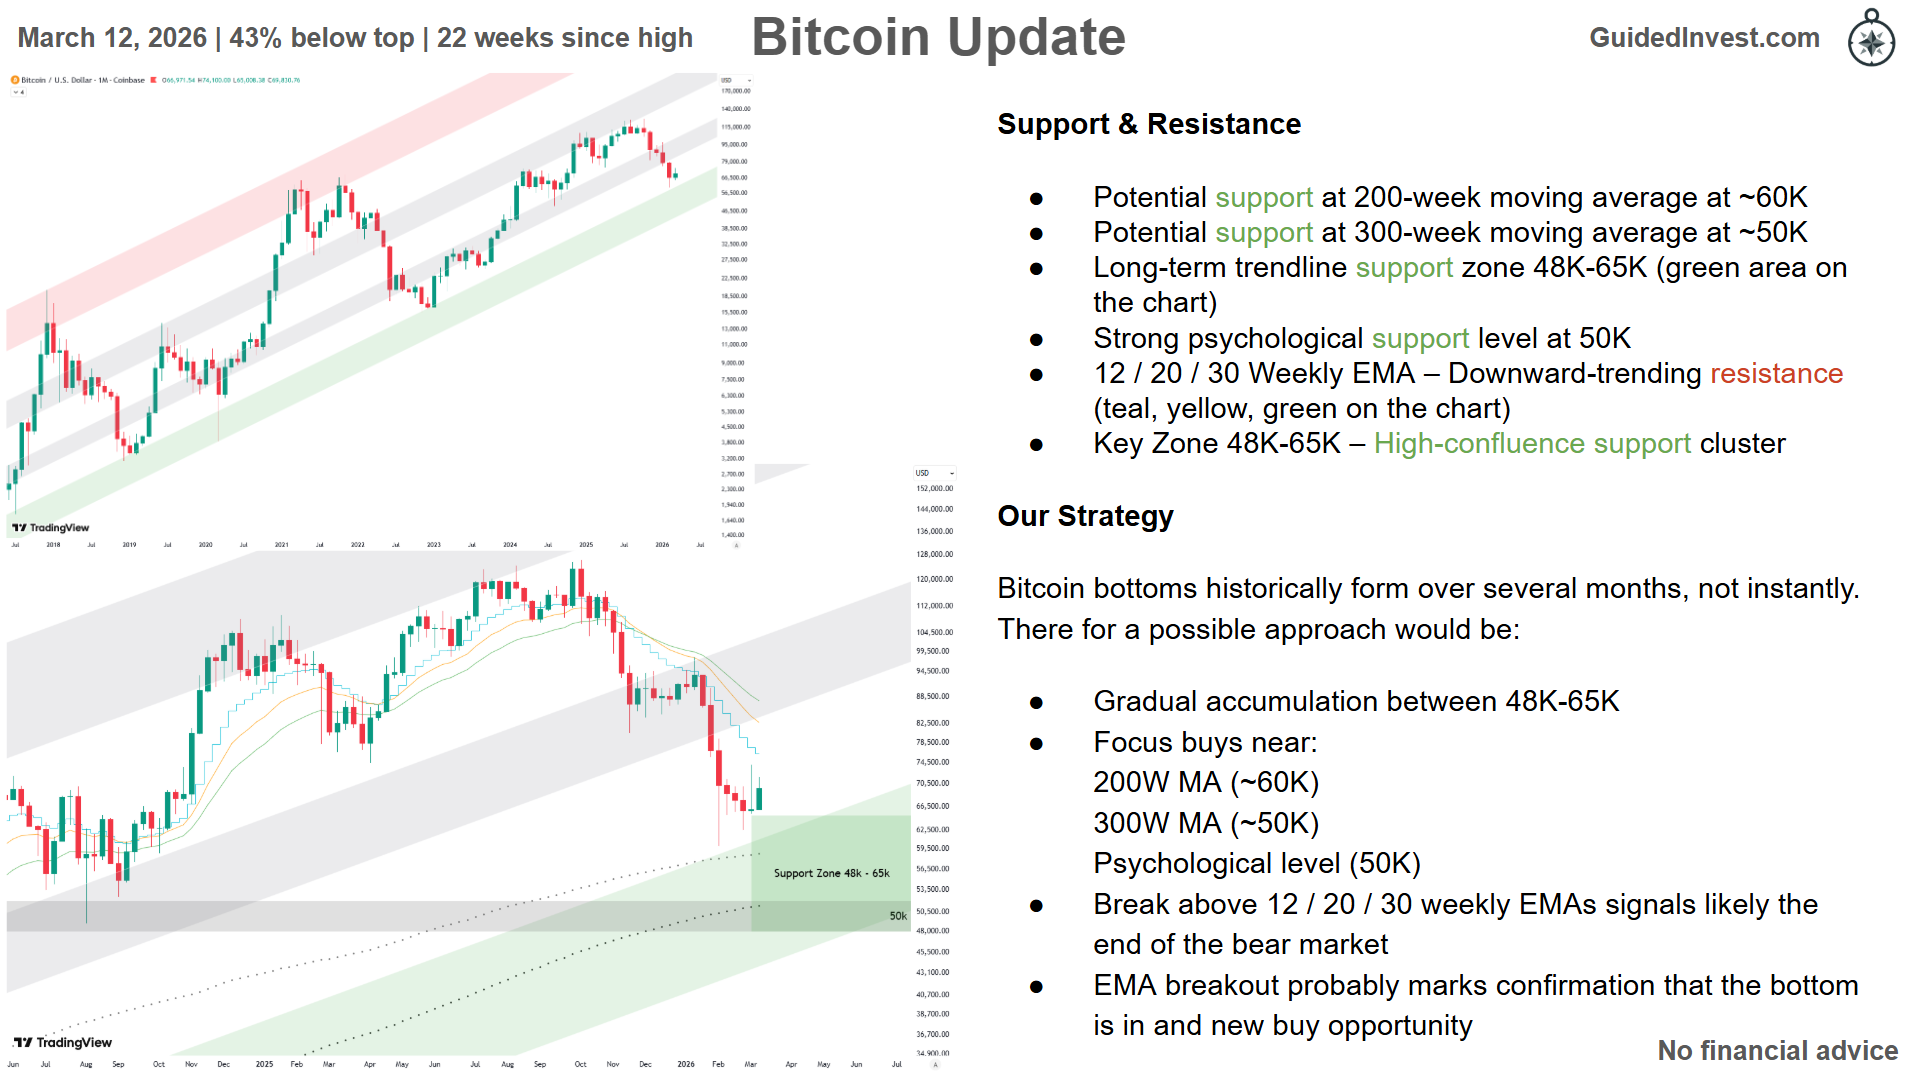
March 12, 2026 | 43% below top | 22 weeks since high
Support & Resistance
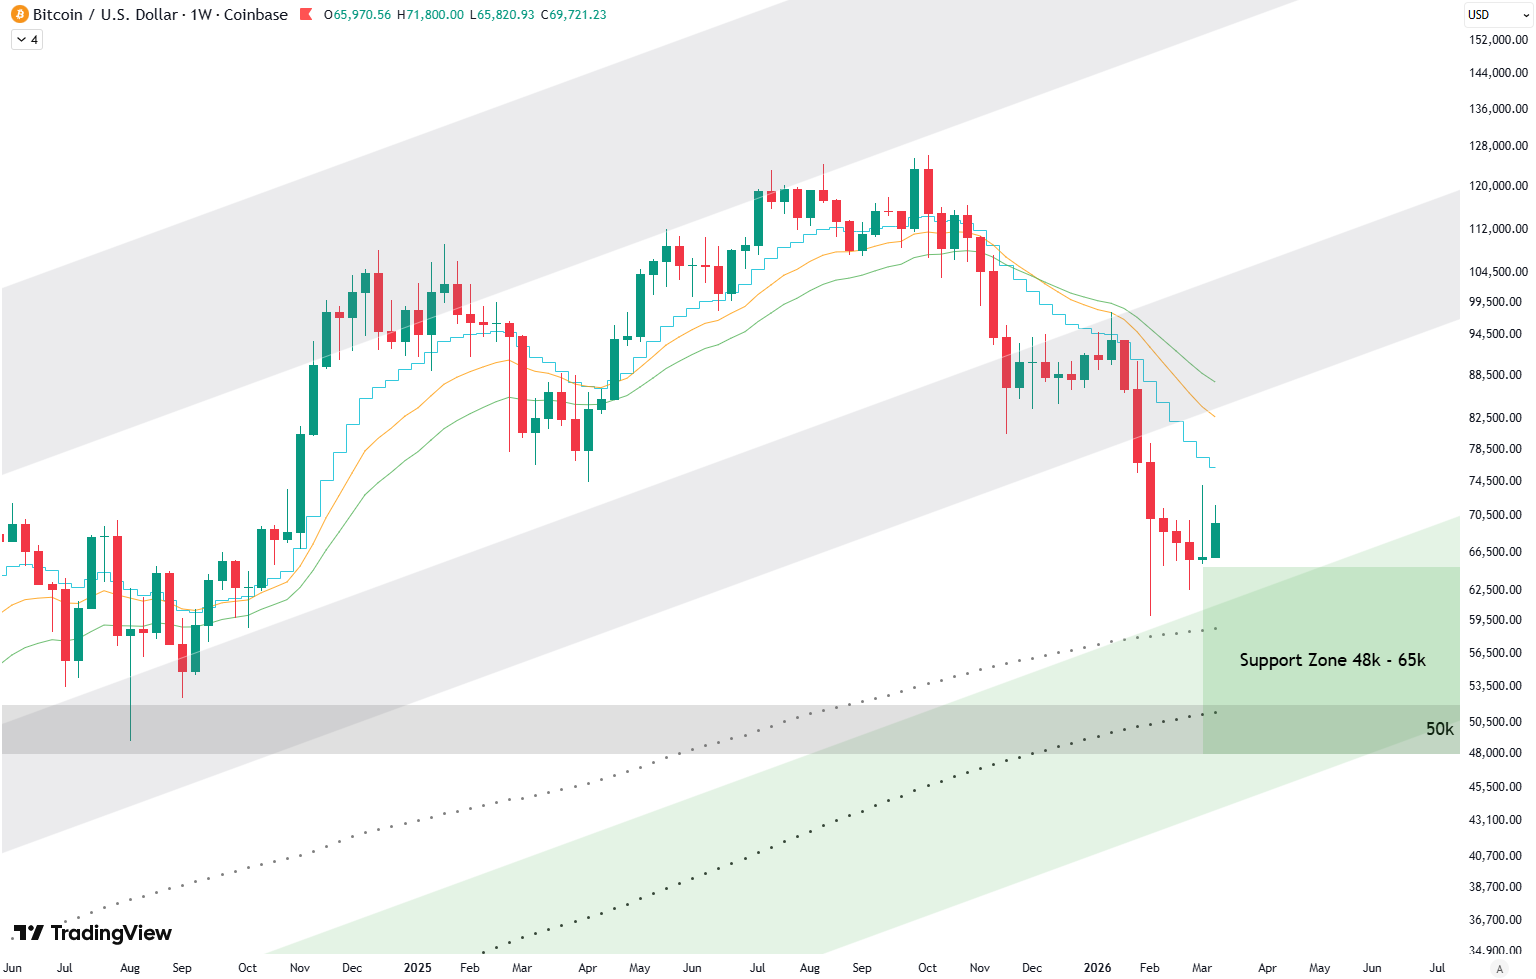
- Potential support at 200-week moving average at ~60K
- Potential support at 300-week moving average at ~50K
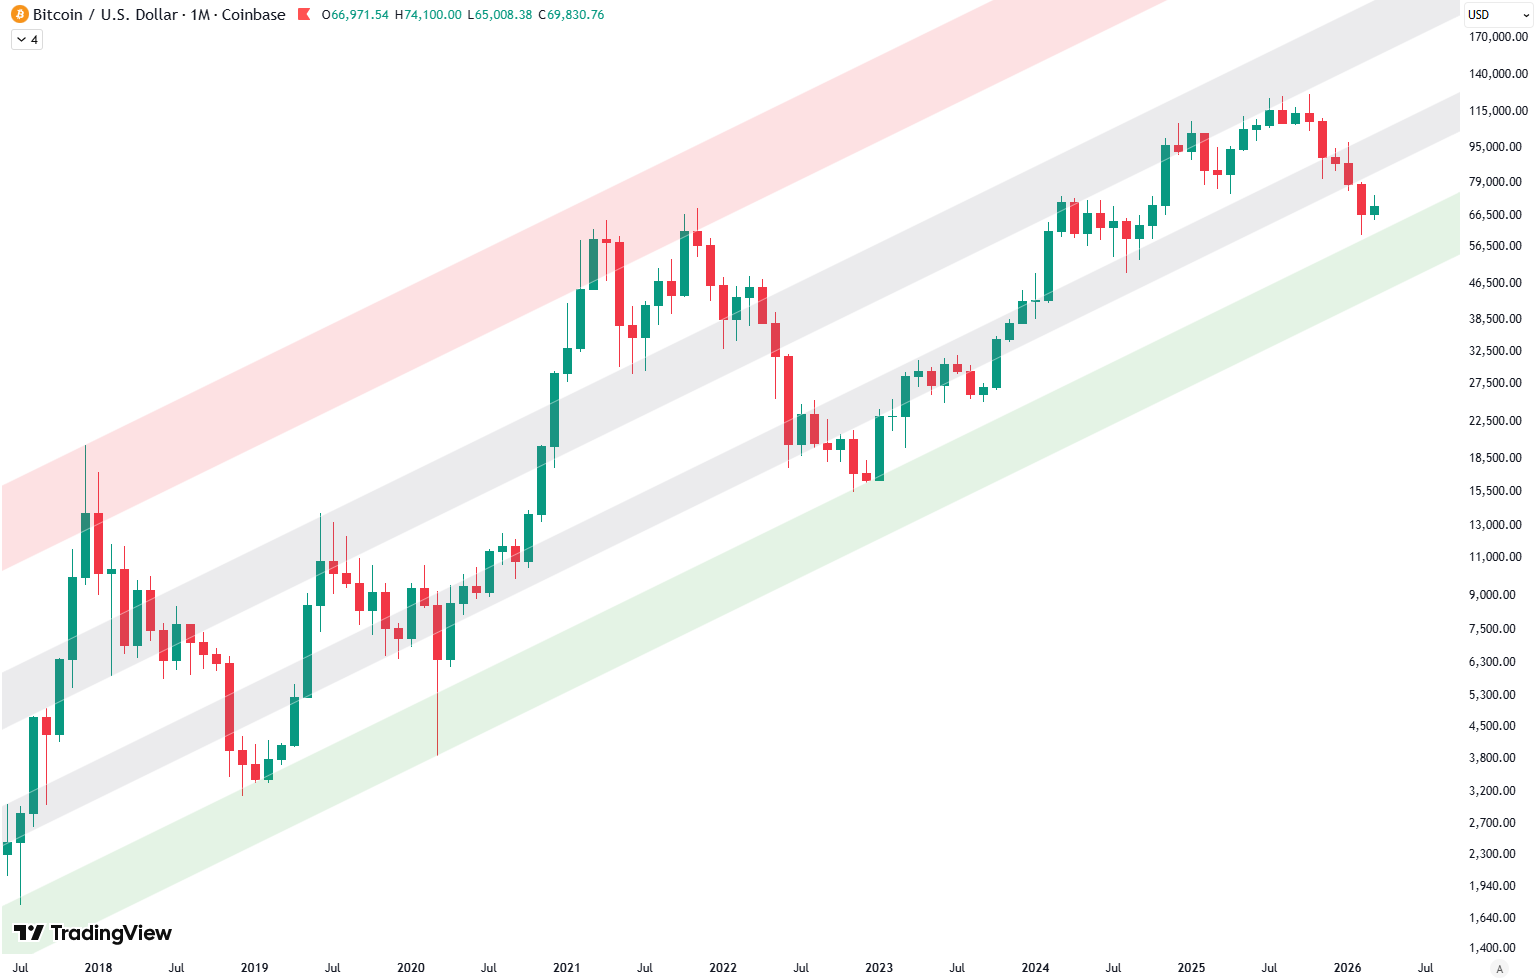
- Long-term trendline support zone 48K-65K (green area on the chart)
- Strong psychological support level at 50K
- 12 / 20 / 30 Weekly EMA – Downward-trending resistance (teal, yellow, green on the chart)
- Key Zone 48K-65K – High-confluence support cluster
Our Strategy
Bitcoin bottoms historically form over several months, not instantly. There for a possible approach would be:
- Gradual accumulation between 48K-65K
- Focus buys near:
200W MA (~60K)
300W MA (~50K)
Psychological level (50K) - Break above 12 / 20 / 30 weekly EMAs signals likely the end of the bear market
- EMA breakout probably marks confirmation that the bottom is in and new buy opportunity
Dashboard
All information summarized in our dashboard:
Stay ahead of the market! Sign up for our weekly updates and get additional expert insights on the S&P 500, key support levels, and market trends.
Leave a Reply