
Hello everybody, and welcome to our weekly analysis on the S&P 500. I’m writing this shortly after the U.S. market open on Friday, so the full trading week isn’t finished yet. So far, it has been a weak week, with the S&P 500 down about 3.2%.Looking at the 4-hour chart, you can see the black trend lines we discussed last week. I extended those lines, and you can see that on Monday we had a test of the 6,800-point zone, which I marked in red. The index was rejected there and dropped into Tuesday by around 600 points. After that, we saw a strong move back up, almost reaching the 6,800-point level again, where the price tested the upper resistance — the upper trend line of the downward-sloping channel shown in black. It was rejected again at that point, also marked in red.
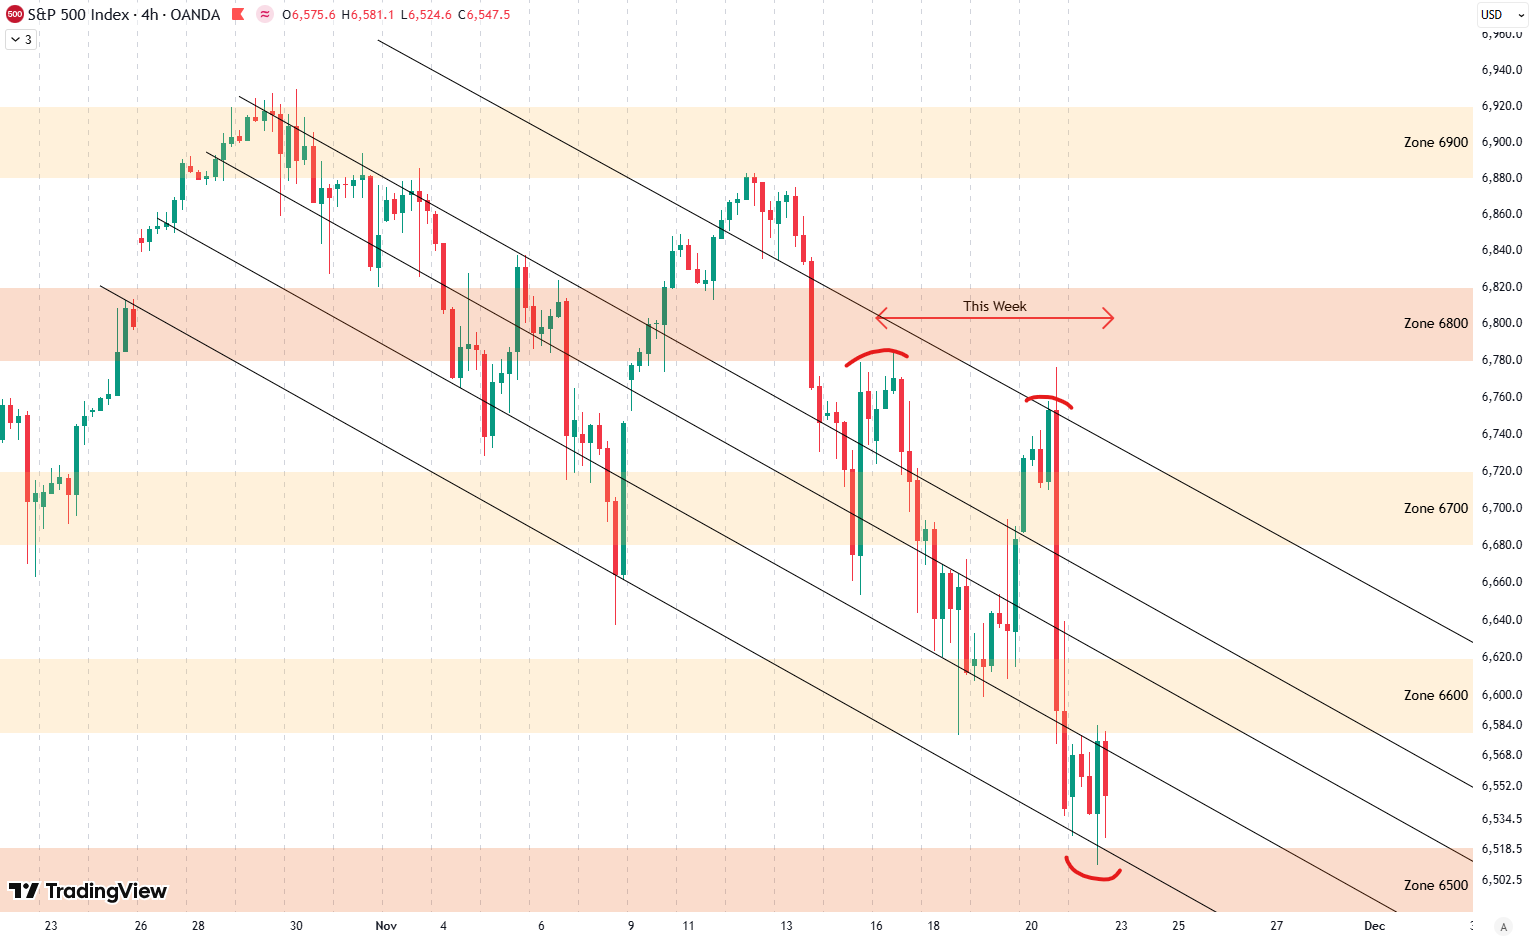
Then on Thursday, we saw a large drop all the way down, and currently, the S&P 500 is trading right above the 6,500-point zone. I marked this support test in red as well. The big question now is how this will develop. In the short term, the market is quite oversold, so a bounce is possible. But the key question is whether the S&P 500 will be able to break out of this downward-sloping trend channel.
Are you wondering when to buy the S&P 500 as an investor? Join our community of smart do-it-yourself investors who are making informed decisions with our expert insights, just by signing up with your email!
Premium Guide
Advanced Investing Signals
Basic Guide
Basic Investing
Signals
Simple Guide
Selected
Signals
Get started today with our free financial guide! Just enter your email, and you’ll start receiving our most popular Simple Guide with exclusive market signals right in your inbox.
S&P 500 Breaks Below Expanding Formation as Trend Weakens
Looking at the 4-hour chart, you can see the black trend lines we discussed last week. I extended those lines, and you can see that on Monday we had a test of the 6,800-point zone, which I marked in red. The index was rejected there and dropped into Tuesday by around 600 points. After that, we saw a strong move back up, almost reaching the 6,800-point level again, where the price tested the upper resistance — the upper trend line of the downward-sloping channel shown in black. It was rejected again at that point, also marked in red.

Then on Thursday, we saw a large drop all the way down, and currently, the S&P 500 is trading right above the 6,500-point zone. I marked this support test in red as well. The big question now is how this will develop. In the short term, the market is quite oversold, so a bounce is possible. But the key question is whether the S&P 500 will be able to break out of this downward-sloping trend channel.On the daily chart, things are also quite interesting. Last week, we discussed the upward-rising expanding formation shown with the green, grey, and red shaded areas. This week, the index broke below that formation on Tuesday. On Wednesday, it tried to recover back inside the pattern but was rejected — I marked this rejection with a red X on the chart — and then we saw the big drop on Thursday.
This break below the expanding formation suggests that the current trend has weakened, and now the market likely needs to consolidate and find a bottom. The most probable area for that is around the 6,500-point support zone, highlighted with the darker red shading. This is a more important support level than the others, and the market may find stability there — but we need confirmation from price action in the coming days.
Short-Term Risk Outlook
Finally, looking at the short-term buy and sell score: the S&P 500 is shown in black, the buy score in green, and the sell score in red. On the bottom we have the longer-term chart going back to the October 2022 low, and above that a zoomed-in chart showing this year including the April low and the strong rally since then.
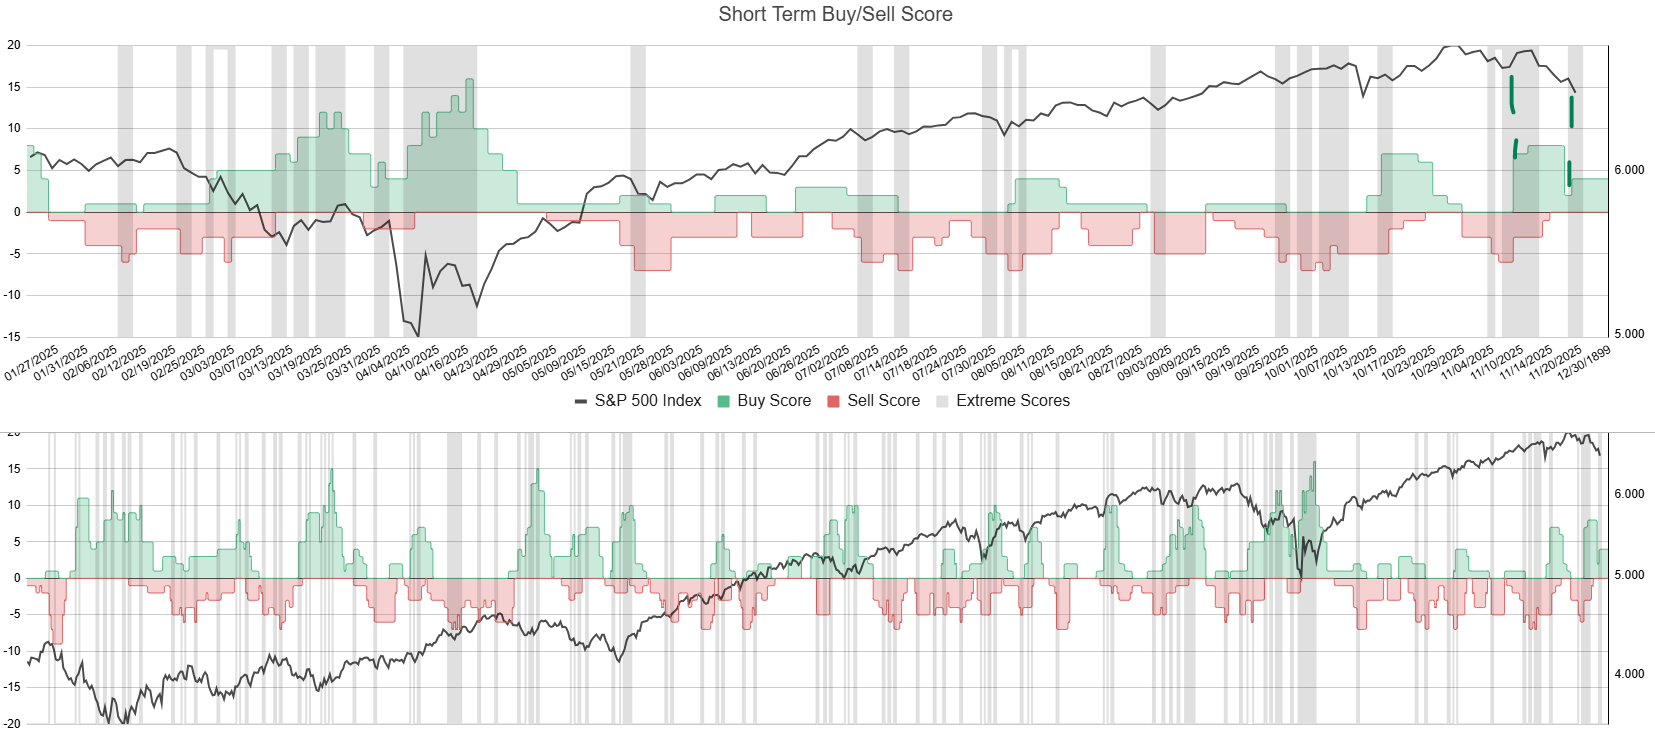
Today, on Friday, we received a second buy signal. I marked it in green on the chart. The buy score increased again and moved above 5, which triggers a buy signal. Historically, whenever the buy score rises above 5, it tends to mark good buying opportunities. You can see this clearly on the longer-term chart — the buy score aligns well with market lows.
Overall, this indicator remains constructive for the S&P 500. When the buy score rises and the market moves lower, it typically suggests good prices to buy. There is nothing here that indicates risk of a crash or a much deeper correction. So far, we are around a five-percent pullback, which is completely normal and was overdue after the very long rally. We finally have a healthy correction that is creating some buying opportunities.
We also have an article (Update: October 30, 2025) on the broader S&P 500 outlook. From a big-picture perspective, the technicals on the weekly chart are less positive and suggest that another correction could be developing in the coming weeks.
For subscribers it is very important to follow our risk management measures that we provide with all our services to protect against losses in case support zones break
Stay ahead of the market! Sign up for our weekly updates and get additional expert insights on the S&P 500, key support levels, and market trends.
S&P 500: Seasonality Insights for 2025
So far this year, the seasonal pattern for the S&P 500 has played out pretty much as expected. The first few months brought some noticeable volatility, which lines up with what we usually see in the early part of the year. Historically, January and February tend to be choppy, and that turbulence can sometimes stretch into March — and that’s exactly what happened this year.
In April, however, we experienced a sharp correction. That move doesn’t align perfectly with the usual seasonal pattern, but it may have represented the weakness that typically shows up in May or June arriving a bit earlier than usual. From that April low, the market rallied strongly through the summer, continuing higher into late July — a period that generally aligns well with historical seasonality.
However, the typical seasonal soft spot in August and September didn’t really appear this year. Usually, those two months bring some volatility or a correction phase, but the S&P 500 instead continued to trade with strength, avoiding any meaningful pullback.

Looking ahead to the remainder of the year — October, November, and December — these months are historically the strongest period of the year for the S&P 500. But given that we’ve already seen such a strong summer rally and skipped the usual correction phase, it’s reasonable to expect that some of that weakness may still be due.
In other words, the correction that typically occurs in late summer might simply have been delayed rather than avoided altogether. That means we could see it emerge in October or November before the market resumes its usual year-end strength.
Seasonality isn’t a perfect roadmap — it rarely plays out exactly the same way each year. But it does offer useful context. Right now, it suggests that while the broader trend remains positive into year-end, a short-term correction could still unfold before the next strong push higher into December.
Of course, this isn’t a guarantee — it’s more of a roadmap based on past patterns. Ultimately, seasonal trends provide valuable context, but they must be considered alongside current market dynamics and technical analysis for a clearer picture.
Track Market Risk with Our Dashboard
Our Market Dashboard provides a quick overview of the current market conditions and, more importantly, the associated risk. You can view a chart of one of our tools, the Risk Level Indicator, showing predicted risk from 1998 to 2025. If you are interested, you can visit our Dashboard site here.

The world of finance is complex and includes many technical terms. For explanations of these terms, I recommend using the Investopedia dictionary.
Leave a Reply