
Welcome to our ETF update. We provide an overview of different ETFs across various asset classes and base our analysis on technicals. We list some ETFs that, from a risk/reward perspective, currently look like good buy opportunities, and others that are better suited as sell or take-profit options right now.
Want to know the best time to invest in any ETF? Join our community of smart do-it-yourself investors who are making informed decisions with our expert insights, just by signing up with your email!
Premium Guide
Advanced Investing Signals
Basic Guide
Basic Investing
Signals
Simple Guide
Selected
Signals
Get started today with our free financial guide! Just enter your email, and you’ll start receiving our most popular Simple Guide with exclusive market signals right in your inbox.
Identifying Buy Zones Using the 12-, 20-, and 30-Week EMAs
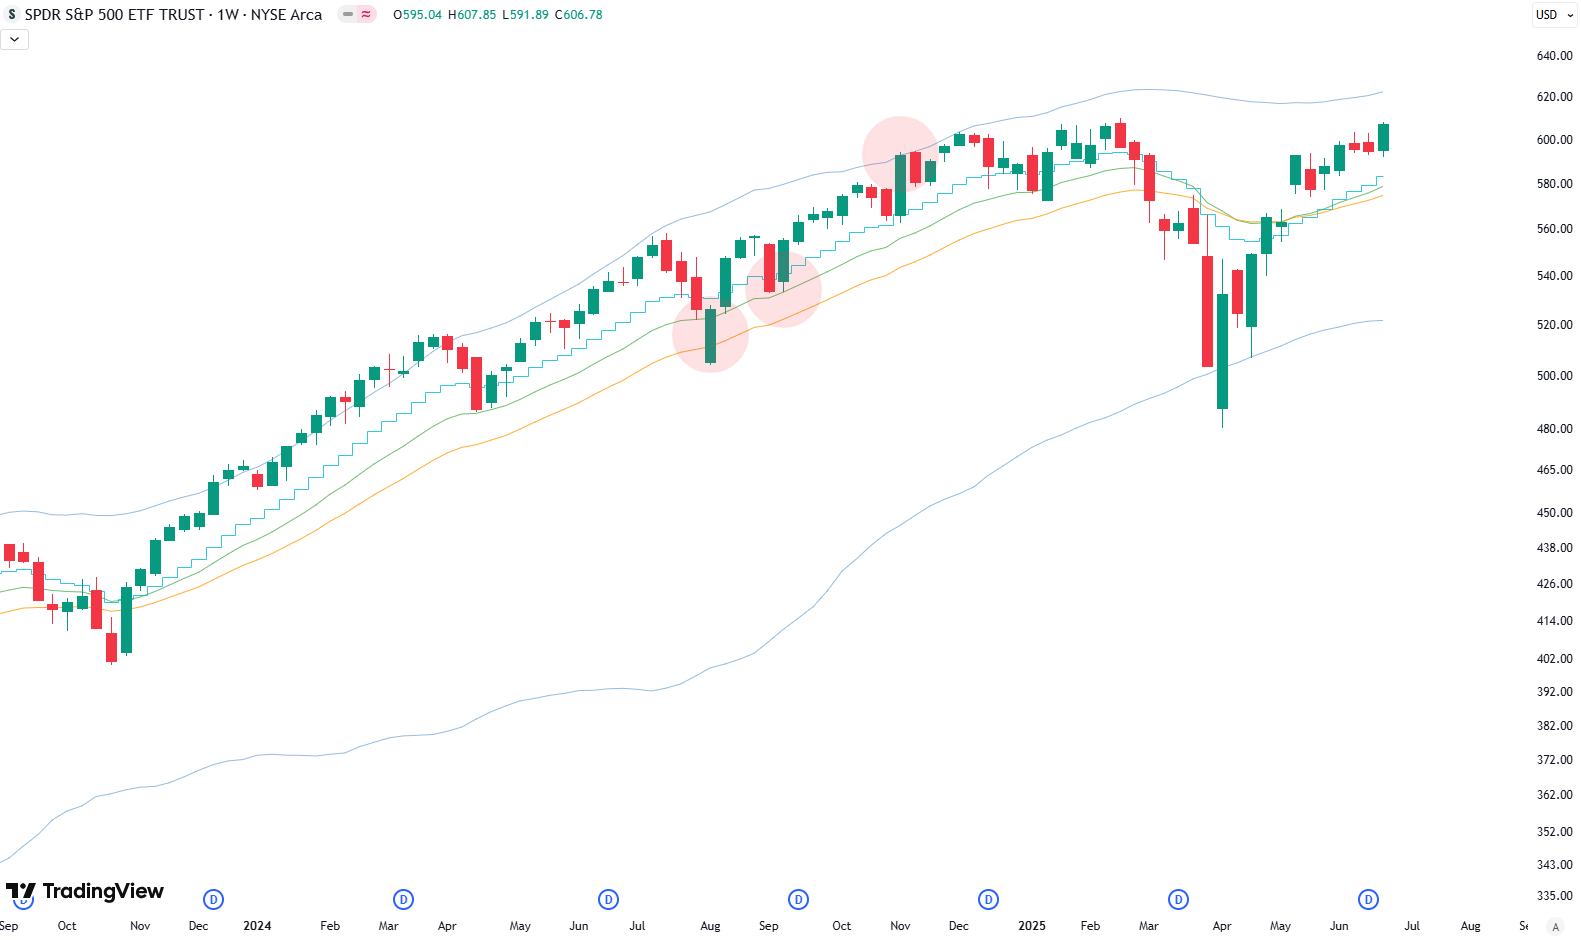
Let’s go over some of the technical approaches we use for analyzing these ETFs. I’ll describe this using an example — the SPY ETF.
We’re looking at a weekly chart, meaning each candle represents one week. We focus on the exponential moving averages (EMAs) — specifically the 12-, 20-, and 30-week EMAs.
Every time the price comes into this moving average zone, we expect it to provide support. That’s when we look to buy the ETF.
Then, when the price goes up and moves outside the two standard deviation Bollinger Band of the 50-week moving average, we take profits and reduce the position size.
Looking again at SPY, you’ll notice how this range of three moving averages has provided support over the last couple of years.
Remember — this is a weekly chart, so we’re talking about slow-moving data and a long-term investment strategy. It’s ideal for investors who don’t want to monitor their ETFs constantly.
So, to summarize with SPY:
- When the price moves into the range of the moving averages, it typically finds support, and prices move up again.
- If the price drops back into the moving average zone, we can buy another portion.
- When the price moves above the Bollinger Band, we reduce the position size.
For example:
- When the price comes down into the area of the EMAs, we buy 1% of our portfolio in the SPY ETF.
- Then, if the price drops into the moving average range again, we buy another 1%.
- I’ve marked these entry points with red circles on the chart.
- If the price moves outside the two standard deviation band of the 50-week moving average, we reduce the position size.
Let’s say the allocation grew to 3% — we cut it back down to the target allocation of 2% (2 × 1%).
You can repeat this process over time — buying and selling portions of the ETF as conditions change.
There is also a sell point marked with a circle on the chart.
If the ETF closes a weekly candle below all three exponential moving averages, we exit the entire position.
Top ETFs Near Support (as of August 14, 2025): What to Watch and Where to Trim
Now, we have a list of ETFs across various asset classes.
We analyze ETFs such as the Gold ETF, the Gold Miners ETF, a Crypto ETF, and, of course, various sectors of the S&P 500, as well as bond ETFs.
The following ETFs are currently trading within the range of the three exponential moving averages — which indicates potential support:
GLD – SPDR Gold Shares ETF
XLRE – Real Estate Select Sector SPDR Fund
DBC – Invesco DB Commodity Index Tracking Fund
The following ETFs are currently trading outside the two standard deviation Bollinger Band of the 50-week moving average — meaning reductions in position size are necessary:
XLK – Technology Select Sector SPDR Fund
MGK – Vanguard Mega Cap Growth ETF
XLU – Utilities Select Sector SPDR Fund
SLV – iShares Silver Trust
GDX – VanEck Gold Miners ETF
SPY – SPDR S&P 500 ETF Trust
XLC – Communication Services Select Sector SPDR Fund
If you’re interested in catching more expert insights and signals like this one in the future, consider signing up with your email to get them delivered when it matters most.
Disclaimer: This is not financial advice. The information provided is for educational and informational purposes only. Please do your own research or consult a financial advisor before making investment decisions.
The world of finance can be complex, with many technical terms. For explanations of financial terminology, try using the Investopedia dictionary.
Leave a Reply