
channel, where the green shaded area represents a support zone at the bottom, the red zone represents a resistance zone at the top of the channel, and the grey shaded areas lie in the middle, serving as both support and resistance — more like balance points.
Looking at the chart, which goes back to July 2023, we can observe quite volatile price movements over the past two years. There was a strong surge in September 2024 into the red resistance zone at the top, but prices were then rejected quite strongly — I’ve marked this with a red circle on the chart — and they dropped all the way to the bottom of the trend channel, finding a low in January 2025 (also marked with a red circle).
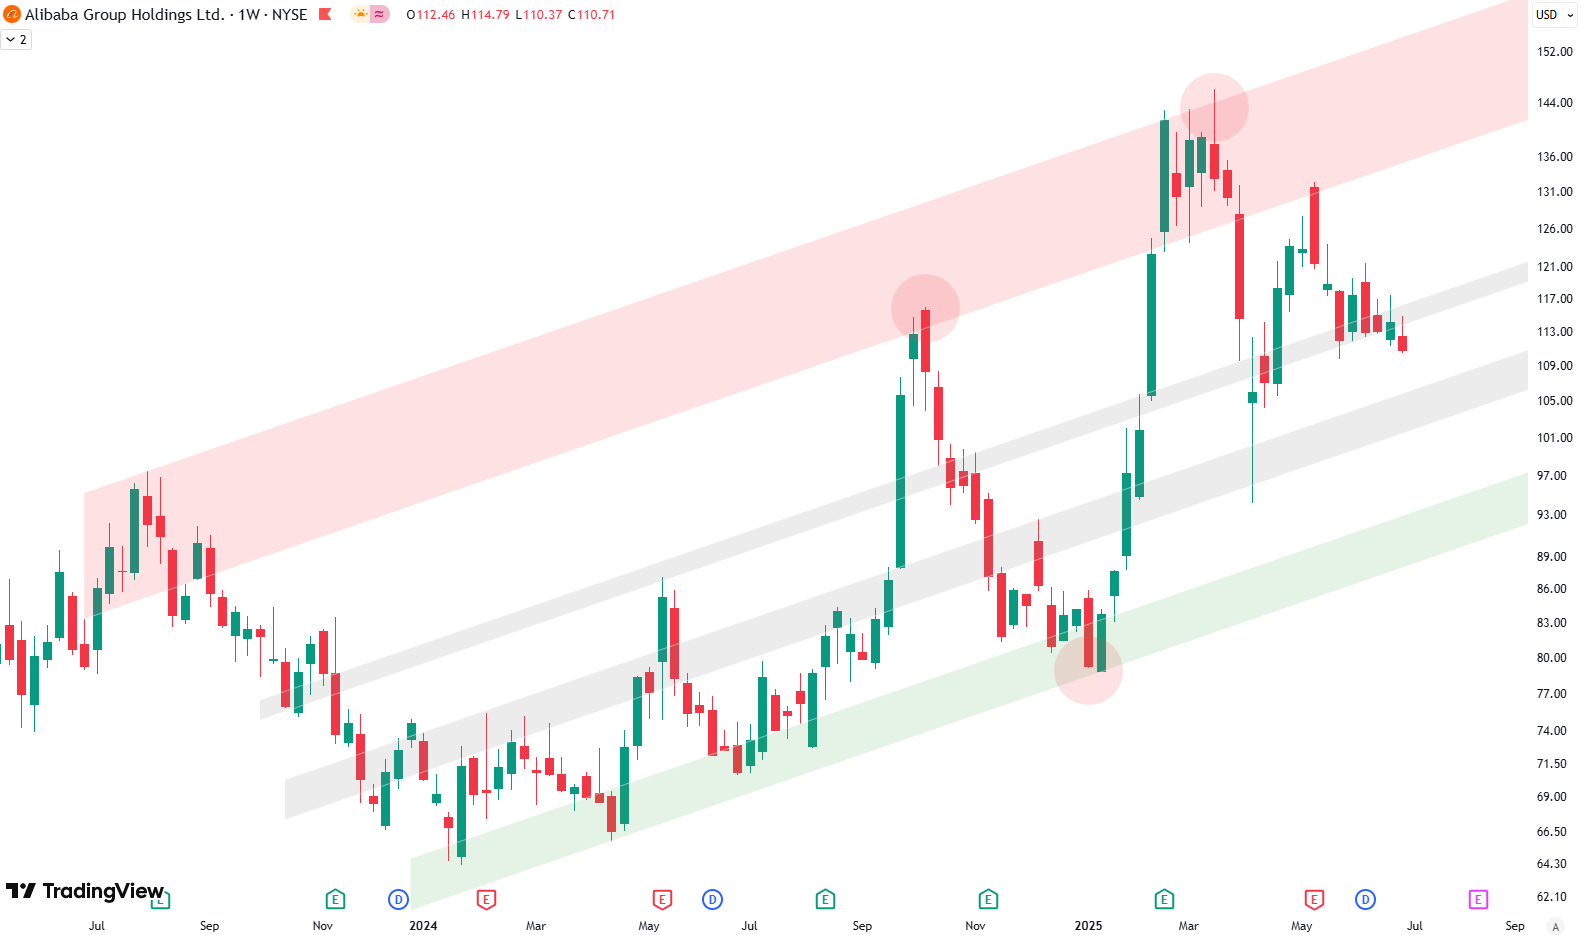
Following that, we saw another strong surge back into the red resistance zone, topping out in March 2025 (again marked with a red circle). Since that March peak, prices have been declining, but they haven’t quite reached the bottom of the channel again. Instead, they found support in the grey shaded area in the middle of the channel. Prices have since risen slightly and are now moving in a consolidation pattern — sideways to downward.
You can also see that we broke the upper grey shaded area and prices are now moving downward toward the lower grey shaded area. This could be an interesting opportunity if we reach that level, as it may present another setup for a move to the upside in the coming months.
Want to know the best time to invest in Alibaba? Join our community of smart do-it-yourself investors who are making informed decisions with our expert insights, just by signing up with your email!
Premium Guide
Advanced Investing Signals
Basic Guide
Basic Investing
Signals
Simple Guide
Selected
Signals
Get started today with our free financial guide! Just enter your email, and you’ll start receiving our most popular Simple Guide with exclusive market signals right in your inbox.
Key Support and Resistance Zones for Alibaba You Should Watch
Now, looking at the daily chart, we can see the March 2025 top, followed by a sharp drop, with support being found again in the lower grey shaded area. Prices rose again afterward, but over the last couple of weeks, they’ve been falling. We can also draw a downward-sloping trend line on the chart, which has so far contained prices during this corrective move.
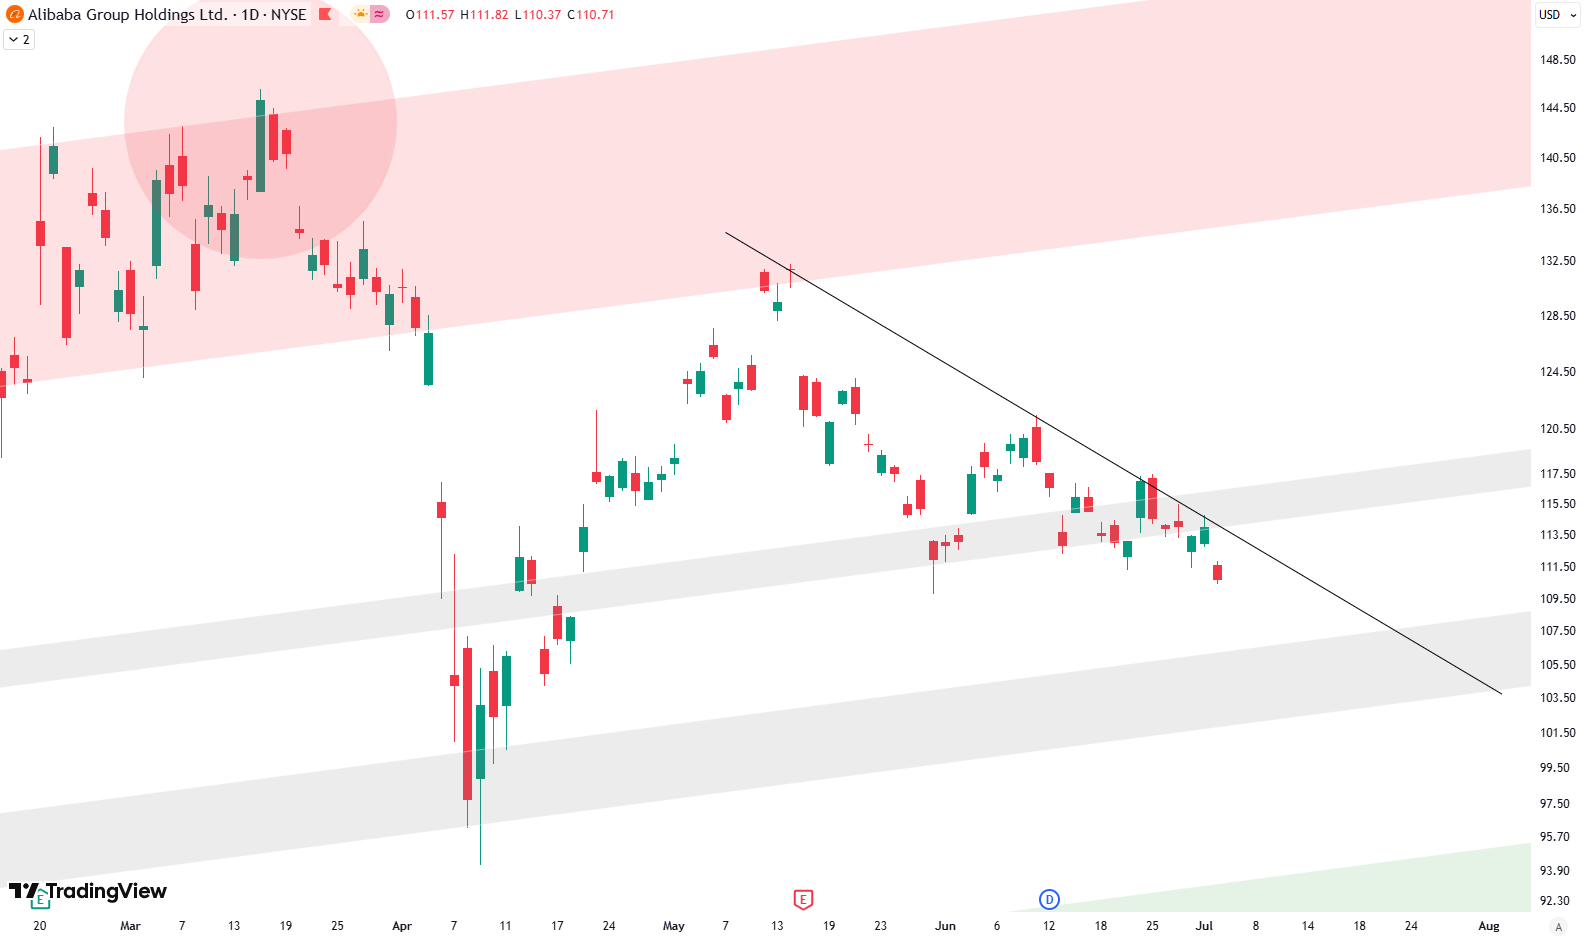
This is definitely something to watch — if prices move above this black trend line, it could be a sign that we’re ready for the next upward move. Additionally, you can see the lower grey shaded area lies around the $105–$106 mark. If prices fall to that level, it could act as a strong support zone. From there, a break above the black trend line could offer an interesting opportunity for Alibaba.
We’ll definitely be keeping an eye on how this develops over the next couple of weeks.
If you’re interested in catching more expert insights and signals like this one in the future, consider signing up with your email to get them delivered when it matters most.
The world of finance can be complex, with many technical terms. For explanations of financial terminology, try using the Investopedia dictionary.
Leave a Reply