
If you’ve ever wondered how strong the U.S. dollar is compared to other major currencies, you’ve probably heard about the U.S. Dollar Index — also known as the DXY. Right now, it’s sitting at a critical spot on the charts, and whether you’re new to investing or just curious, it’s worth paying attention.
What is the DXY and Why Does It Matter?
The DXY is a measure of the dollar’s value against a basket of other major currencies. The Euro, Japanese Yen, and Swiss Franc make up the majority of the index.
The Long-Term Trend: Since 2008
Looking at the monthly chart, you’ll notice that since 2008, the DXY has been climbing within a clear upward-sloping trend channel. This channel is marked by three shaded zones: green (support), gray (neutral/balance), and red (resistance).
Whenever the dollar hits the green zone, it tends to bounce higher. When it reaches the red, it often cools off. It’s like the dollar is moving within its own natural cycle.

A few key moments stand out:
- 2008: Major spike during the financial crisis as investors rushed to safety.
- 2011: Found strong support in the green zone and began a rally.
- 2017: Hit resistance at the top red zone.
- 2021: Another bounce from support.
- 2022: Reached a high again near the red zone — and since then, it’s been falling.
Why Now Is So Important
Fast-forward to today, and the dollar is once again sitting in the green shaded support zone. It’s also hovering around the psychologically and technically important 100 level, which you can see drawn as a bold orange line on the chart.
This level has been a battlefield before:
- In 2015–2016, it acted as resistance.
- In 2020, again as resistance.
- In 2023, it became support.
And now? We’re right back there.
This overlapping of long-term support from the channel and the 100 level makes this a potentially powerful launching pad — or a warning sign.
Want to know the best time to invest? Join our community of smart do-it-yourself investors who are making informed decisions with our expert insights, just by signing up with your email!
Premium Guide
Advanced Investing Signals
Basic Guide
Basic Investing
Signals
Simple Guide
Selected
Signals
Get started today with our free financial guide! Just enter your email, and you’ll start receiving our most popular Simple Guide with exclusive market signals right in your inbox.
Zooming Into 2025: The Daily Chart View
To get a better feel for what’s happening day to day, we can zoom in on the daily chart.
Since mid-January 2025, the dollar index has dropped sharply — down about 11%. For a currency, that’s a big move.
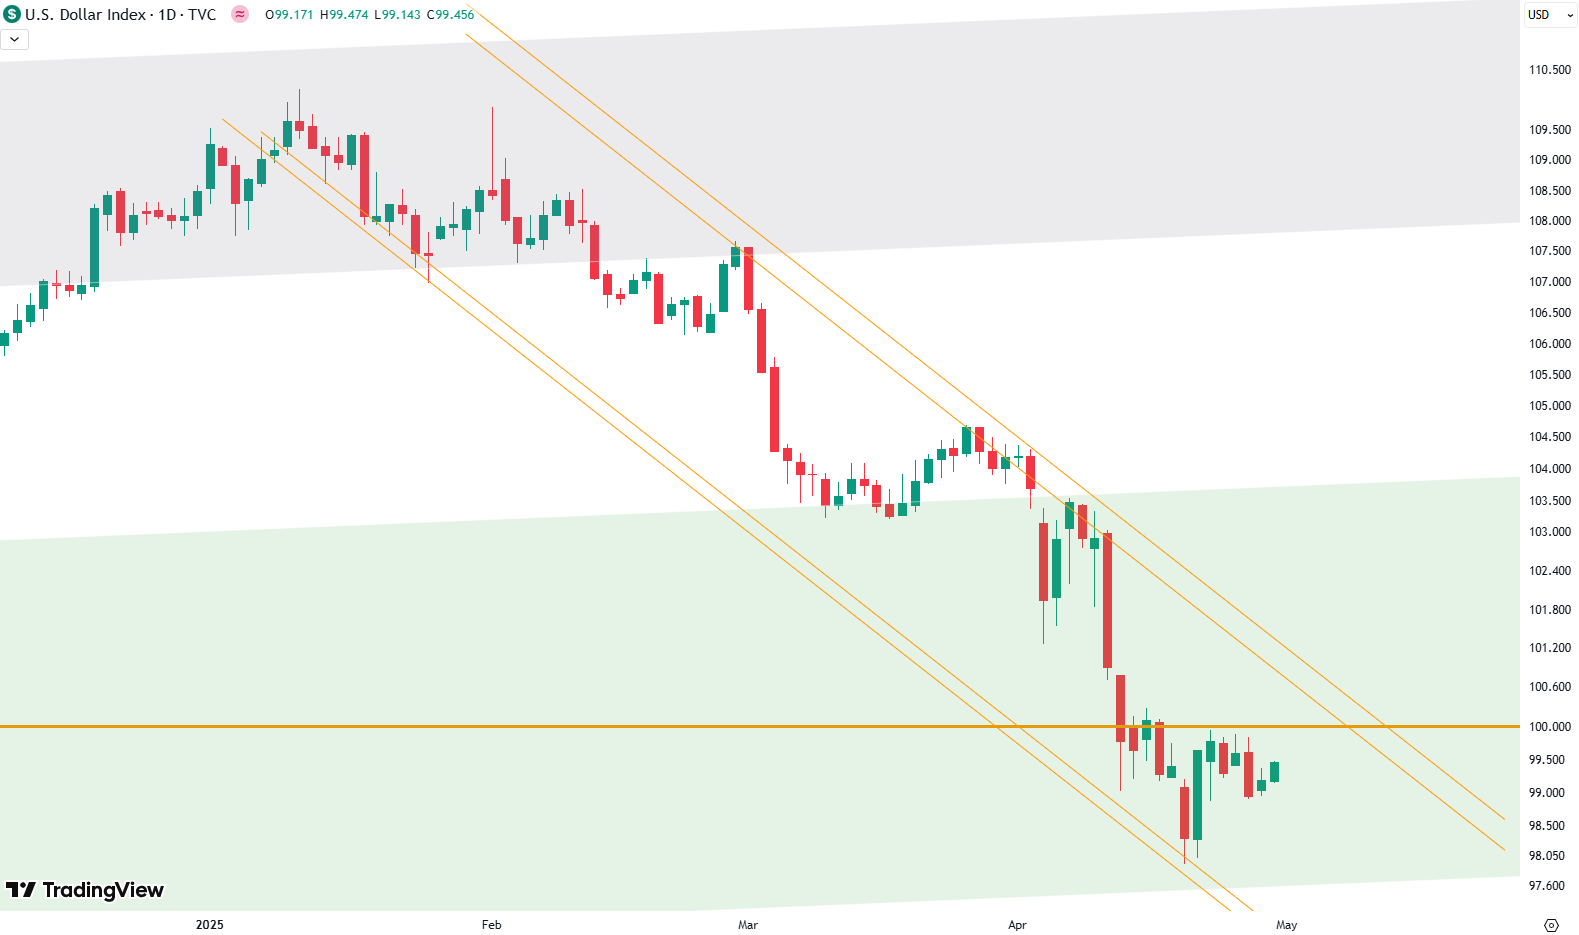
This decline formed a downward-sloping channel, marked by orange trend lines. Price has been mostly staying inside this range, bouncing between resistance on the top and support on the bottom. The most recent low was on April 21st — and since then, we’ve seen a small bounce.
Now here’s where things get interesting. If the dollar can break above 100 again and push through the top of this orange trend channel, we might be looking at the start of a new upward leg.
What’s Next? Targets and Scenarios
Looking again at the bigger picture — the monthly chart — we’re really at a key crossroads. If the green support zone holds and the dollar starts to bounce, the next likely target sits in that gray mid-zone, around 112.
If momentum picks up from there, we could even see a push toward the red resistance zone near 124 — right at the top of the long-standing upward channel.
But if the dollar breaks down below that green support zone and can’t recover, then things could shift in a much more serious way. We might be looking at a break of the entire trend structure — something that’s been guiding the dollar for nearly 20 years.
This is a critical moment. Whether that rising trend channel holds or breaks will tell us a lot about where the dollar — and maybe the broader macro picture — is headed next. It’s something we’ll definitely want to watch closely over the coming weeks and months.
Final Thoughts
Whether you’re brand new to markets or just getting your feet wet with technical charts, this is one of those moments that could set the tone for months (or years) to come.
So if you’ve ever thought about tracking the dollar — now’s the time to do it.
If you’re interested in catching more expert insights and signals like this one in the future, consider signing up with your email to get them delivered when it matters most.
The world of finance can be complex, with many technical terms. For explanations of financial terminology, try using the Investopedia dictionary.
Leave a Reply