
Let’s check in on NVIDIA this week. Starting off with the weekly chart (we’re looking back to 2021 here), there’s a clear upward trend channel made up of green, gray, and red shaded zones. These aren’t just colors — they’ve played real roles over time. The green zone has acted as support, the red one as resistance, and the gray zone sits right in the middle, often acting like a balance point.
Even though we’re just seeing the trend from 2021 onward, this rising channel actually began way back in 2013. What really stands out is how steep the rise has been in recent years. NVIDIA climbed all the way into the red resistance zone by 2024.

And right there — inside that red zone — a rising wedge pattern formed. You’ll see this marked on the chart with red trend lines. A rising wedge is often a bearish signal. So between that pattern and the fact that price was up at the top of the trend channel, there were two pretty solid warning signs.
At that point, we mentioned in an article that a pullback looked likely and it might be a smart time to lock in some profits. And that’s exactly what played out. NVIDIA dropped more than 40% from those highs. Now it’s back down around the gray shaded area — a level that has potential to act as support again.
Want to know the best time to invest in Nvidia? Join our community of smart do-it-yourself investors who are making informed decisions with our expert insights, just by signing up with your email!
Premium Guide
Advanced Investing Signals
Basic Guide
Basic Investing
Signals
Simple Guide
Selected
Signals
Get started today with our free financial guide! Just enter your email, and you’ll start receiving our most popular Simple Guide with exclusive market signals right in your inbox.
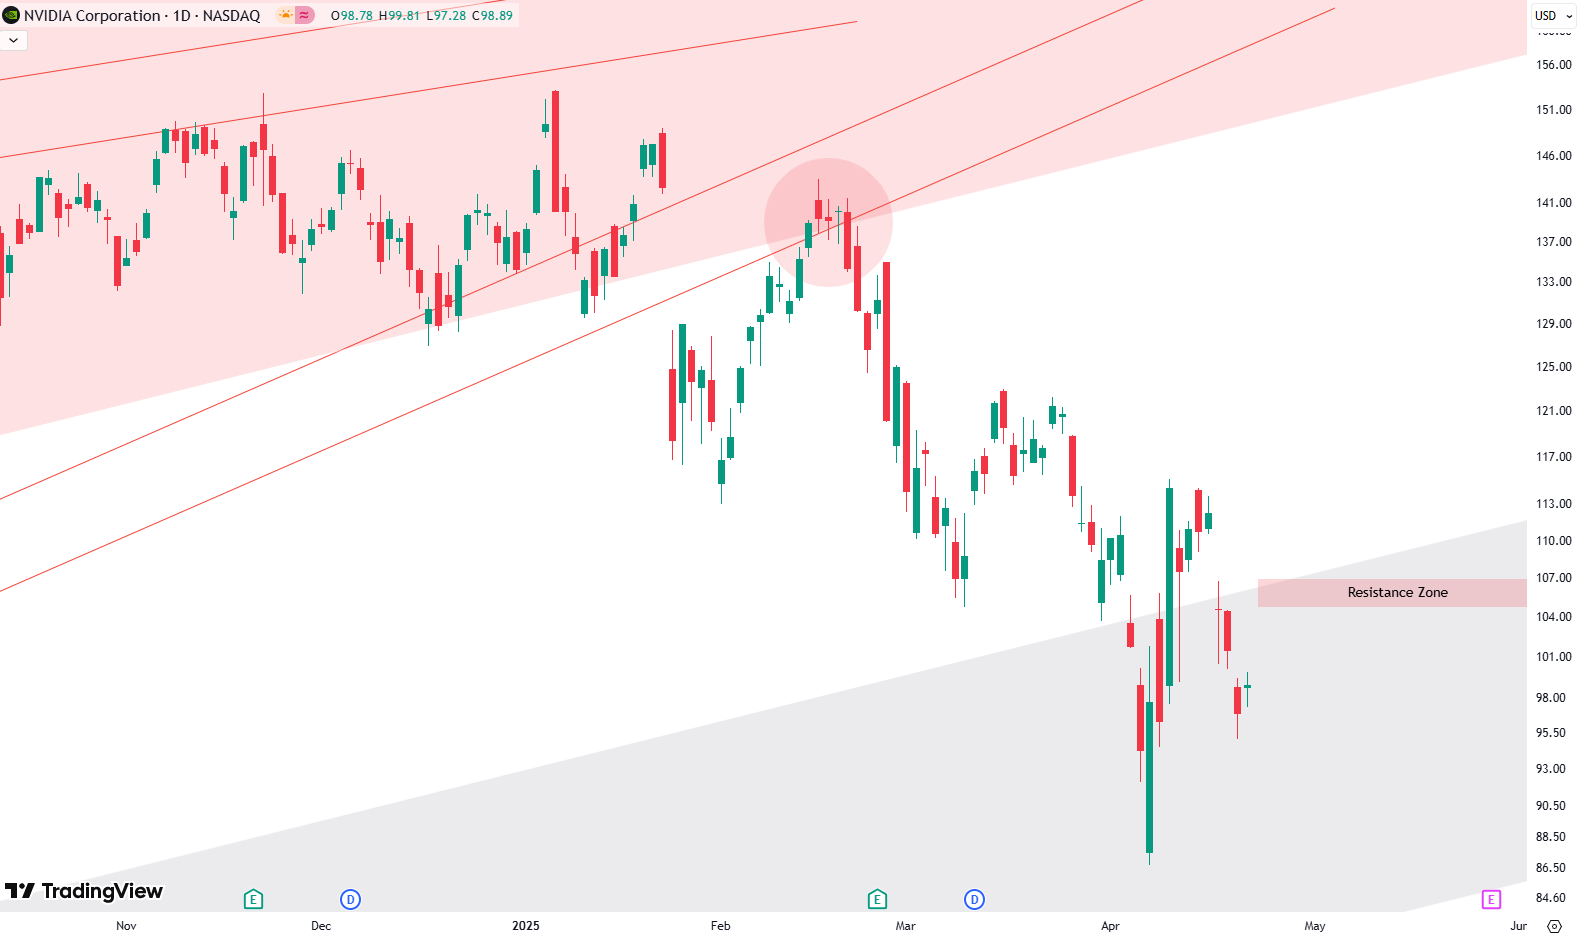
A Closer Look at the Daily Setup
Looking at the daily chart now, you can see a fairly smooth and controlled decline. It’s been a classic pattern of lower lows and lower highs — just steadily drifting lower. There’s also a retest of the broken wedge pattern before the drop continued. That’s circled in red on the chart.
At the moment, price is sitting in the gray zone again. This also happens to align with a strong horizontal support level. It’s a zone where things could start to shift.
If NVIDIA is able to make a higher low here — meaning the decline slows down and starts turning — and then follow that with a higher high, it could be the start of a rebound. And if that resistance zone gets broken in the next few weeks, this might end up being a really nice buying opportunity.
There’s no strong sign right now that NVIDIA is about to collapse further. More likely, this is an area where support could kick in and buyers might start stepping back in. If that’s the case, we might see a move back toward new all-time highs.
And with a stock like NVIDIA, those types of moves can be huge. The current all-time high is over 50% above the current price level. That’s a big potential gain if you’re in early.
We’ll see how things develop over the coming weeks. The key thing to watch is how NVIDIA reacts to this resistance zone. If it breaks through, the setup could become very interesting again.
If you’re interested in catching more expert insights and signals like this one in the future, consider signing up with your email to get them delivered when it matters most.
The world of finance can be complex, with many technical terms. For explanations of financial terminology, try using the Investopedia dictionary.
Leave a Reply