
Welcome to our weekly newsletter on the S&P 500!
This week, the S&P 500 lost 3.1%, marking another tough week for the market.
Looking at the 4-hour chart, we can see how the 6,000-point level—which used to be strong support—has now turned into a resistance zone.
As expected, the market saw a bounce on Monday, but it was quickly rejected at the 6,000 resistance level, leading to a sharp 2% drop. Selling pressure continued through the week, keeping the S&P 500 in a clear downtrend.

What stands out now are the two green trendlines acting as resistance. Every attempt to rally has been blocked at these levels. If the market breaks above them, it could lead to a bigger relief rally—or possibly even signal a bottom. But so far, that hasn’t happened.
Our last trade on the S&P 500 was back in November. Since then, the market hasn’t produced any clear signals, so we stayed on the sidelines. Looking at how the S&P 500 has been moving—up and down with no clear direction—this decision served us well.
Our last position, which we placed on November 20, has been active until December 10, when we sold it for a gain of 5.7%
Are you wondering when to buy the S&P 500 as an investor? Join our community of smart do-it-yourself investors who are making informed decisions with our expert insights, just by signing up with your email!
Premium Guide
Advanced Investing Signals
Basic Guide
Basic Investing
Signals
Simple Guide
Selected
Signals
Get started today with our free financial guide! Just enter your email, and you’ll start receiving our most popular Simple Guide with exclusive market signals right in your inbox.
Big Support Test Ahead
The daily chart shows where we stand in the current market movement. The 6,000 level remains a key resistance, which was retested before Monday’s decline. An upper support zone held on Tuesday and Wednesday but eventually broke on Thursday. Now, the next major support zone aligns with last July’s high, and the market tested this level on Friday.
A key observation is that we are now back inside a falling channel that formed during the December correction. Right now, the market is testing the lower boundary of that channel, which also aligns with a strong support zone marked by the green box.
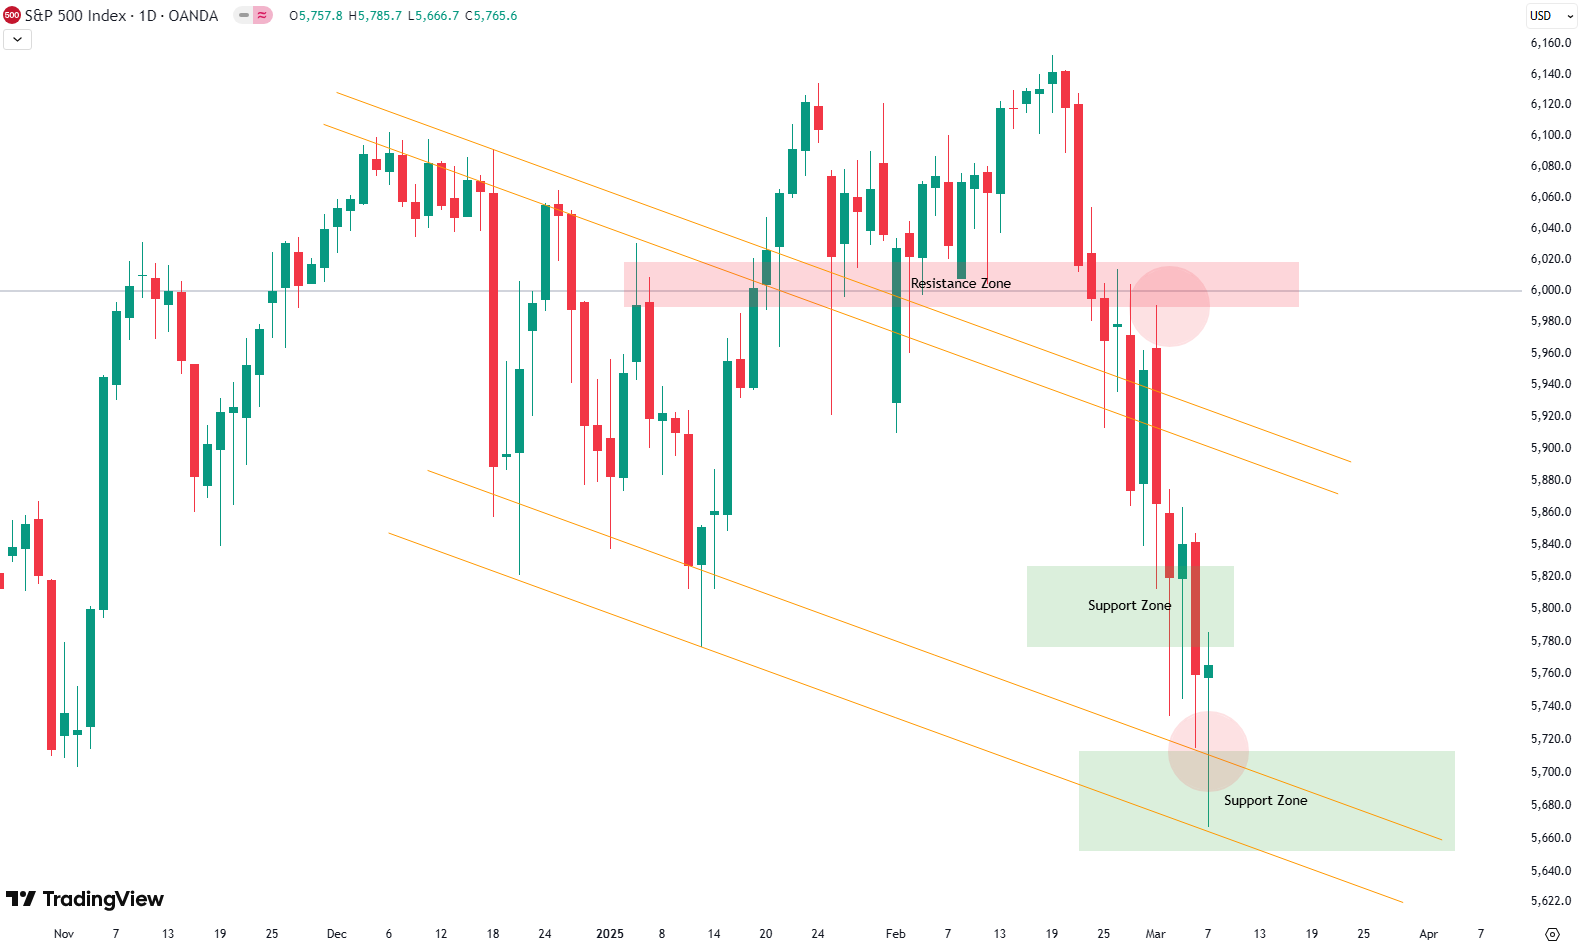
The S&P 500 has dropped sharply since its February 19 high, and now, several indicators are signaling oversold conditions. The RSI is sitting at 30, which typically suggests the market is oversold. Additionally, the S&P 500 is now trading outside the lower Bollinger Band, a technical sign that we may be due for a bounce. These conditions usually don’t last long—often just a few days—but they tend to trigger at least a short-term rebound. A first bounce already occurred on Friday, and this could continue into next week.
Looking at the weekly chart, we can see the long-term trend channel that has been in place since October 2022. This trend consists of three zones: the red zone (resistance), the gray zone (balance point), and the green zone (support). Last week, the market closed below the gray zone, which is notable because price rarely closes outside this level. The last time this happened was in October 2023, which led to a bigger decline before eventually finding support in the green zone.

If this pattern repeats, the recent breakdown suggests we could see further downside before the market finds support. That said, any rally from here might just be a retest of the gray zone before another move lower. It’s something to keep an eye on in the coming weeks.
For subscribers it is very important to follow our risk management measures that we provide with all our services to protect against losses in case support zones break
Stay ahead of the market! Sign up for our weekly updates and get expert insights on the S&P 500, key support levels, and market trends.
S&P 500: Seasonality Insights for Early 2025
Seasonality charts often provide helpful context for understanding market tendencies. Historically, the S&P 500 exhibits a choppy start to the year, with January and February experiencing turbulence that can extend into mid-March. This seasonal pattern suggests the potential for weakness in the coming weeks.
However, this type of analysis should always be approached cautiously. While seasonal trends indicate broad expectations, they cannot predict the future. Notably, last year saw significant deviations from typical patterns, with strength in the market that outpaced historical norms.
If seasonality holds true, this early choppiness might be followed by stabilization. Still, after the notable price increases seen in late 2024, investors should prepare for possible volatility and ensure proper risk management strategies are in place.
Ultimately, seasonal trends provide valuable context, but they must be considered alongside current market dynamics and technical analysis for a clearer picture. The S&P 500’s behavior during this critical time will reveal whether the seasonal weakness manifests or if the market defies expectations again.

Track Market Risk with Our Dashboard
Our Market Dashboard provides a quick overview of the current market conditions and, more importantly, the associated risk. You can view a chart of one of our tools, the Risk Level Indicator, showing predicted risk from 1998 to 2024. If you are interested, you can visit our Dashboard site here.

The world of finance is complex and includes many technical terms. For explanations of these terms, I recommend using the Investopedia dictionary.
Leave a Reply