
Hello, everyone! This week, we’re diving into the DAX and its long-term trends. Looking at the quarterly chart, each candle represents three months, giving us a broad perspective all the way back to 1980. The trend is clear—DAX has been moving within a well-defined channel, respecting key support and resistance levels.

The green shaded area at the bottom has consistently acted as strong support. Every time the price touched it, the market bounced back. On the other hand, the red shaded area at the top has only been tested once, making it a critical resistance zone. Right now, the DAX is moving within the gray shaded zone, a middle-ground area that often acts as both support and resistance.
Want to know the best time to invest in the DAX? Join our community of smart do-it-yourself investors who are making informed decisions with our expert insights, just by signing up with your email!
Premium Guide
Advanced Investing Signals
Basic Guide
Basic Investing
Signals
Simple Guide
Selected
Signals
Get started today with our free financial guide! Just enter your email, and you’ll start receiving our most popular Simple Guide with exclusive market signals right in your inbox.
Zooming Into the Weekly Chart
Switching to the weekly chart, which gives us a closer look, we see a similar trend. These trend lines have been respected since mid-2022. The green trend line has been a strong support zone, while the red shaded area has served as resistance. The latest price action shows that the DAX was rejected at this red zone, which could mean resistance is kicking in again.
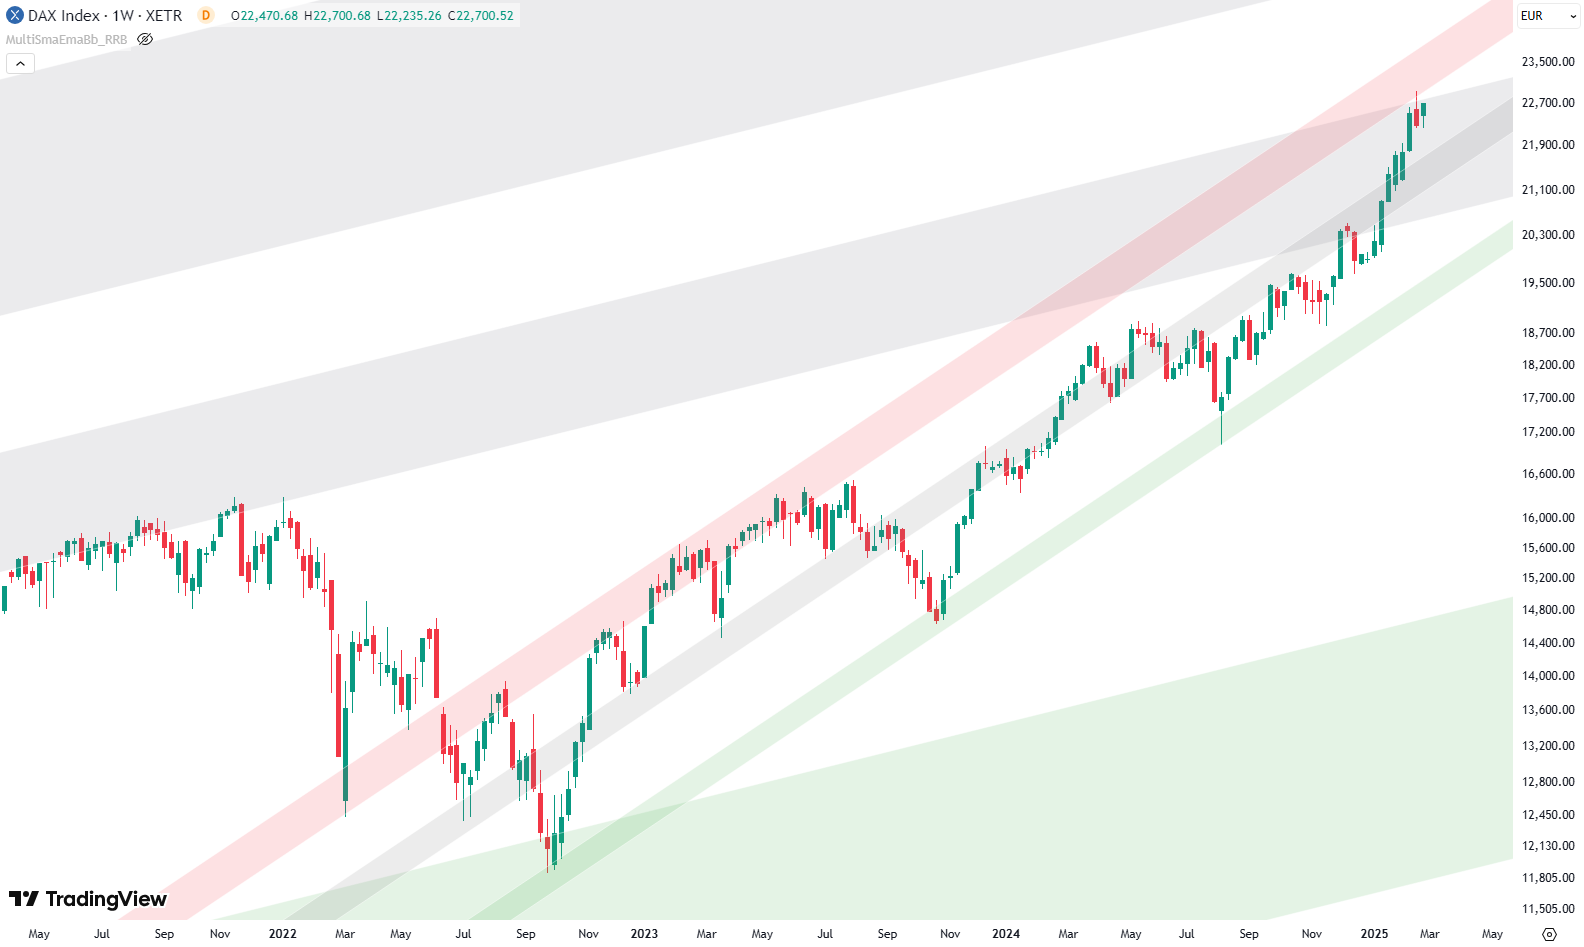
Interestingly, back in 2021, the DAX also reached the gray shaded area from the quarterly chart and was rejected afterward. Now, history could be repeating itself, as we are at a similar double resistance—both from the quarterly gray zone and the weekly red zone.
What the Daily Chart is Telling Us
Looking at the daily chart, we can see a clear reaction to this resistance level. The last time the price hit the red shaded area, it was strongly rejected, leading to a noticeable pullback. Given this recent price movement, we could expect further downside pressure.

With resistance coming in at multiple levels, it’s going to be very interesting to see how the DAX reacts in the coming weeks. If the index fails to break through, we might see a pullback or consolidation.
For expert insights and signals, you can receive direct updates straight to your inbox—just enter your email and stay ahead of the market.
The world of finance can be complex, with many technical terms. For explanations of financial terminology, try using the Investopedia dictionary.
Leave a Reply