
Tesla’s Stock Drop: A Healthy Correction or More Pain Ahead?
Tesla’s recent decline has some investors worried, but let’s put it into perspective. Looking at the monthly chart, Tesla has been moving within a well-defined trend channel since 2011. This trend consists of multiple parallel support and resistance levels—green, gray, and red shaded areas—that have consistently influenced price action.
Whenever Tesla hit the upper red resistance zone, it pulled back. When it approached the lower green support zone, it found buyers. This has been the case for over a decade.

Recently, Tesla’s stock hit the upper gray resistance area and has since corrected lower, now approaching the lower gray support area. This kind of movement isn’t unusual—markets don’t go straight up forever, and healthy corrections are part of the process.
Want to know the best time to invest in Tesla? Join our community of smart do-it-yourself investors who are making informed decisions with our expert insights, just by signing up with your email!
Premium Guide
Advanced Investing Signals
Basic Guide
Basic Investing
Signals
Simple Guide
Selected
Signals
Get started today with our free financial guide! Just enter your email, and you’ll start receiving our most popular Simple Guide with exclusive market signals right in your inbox.
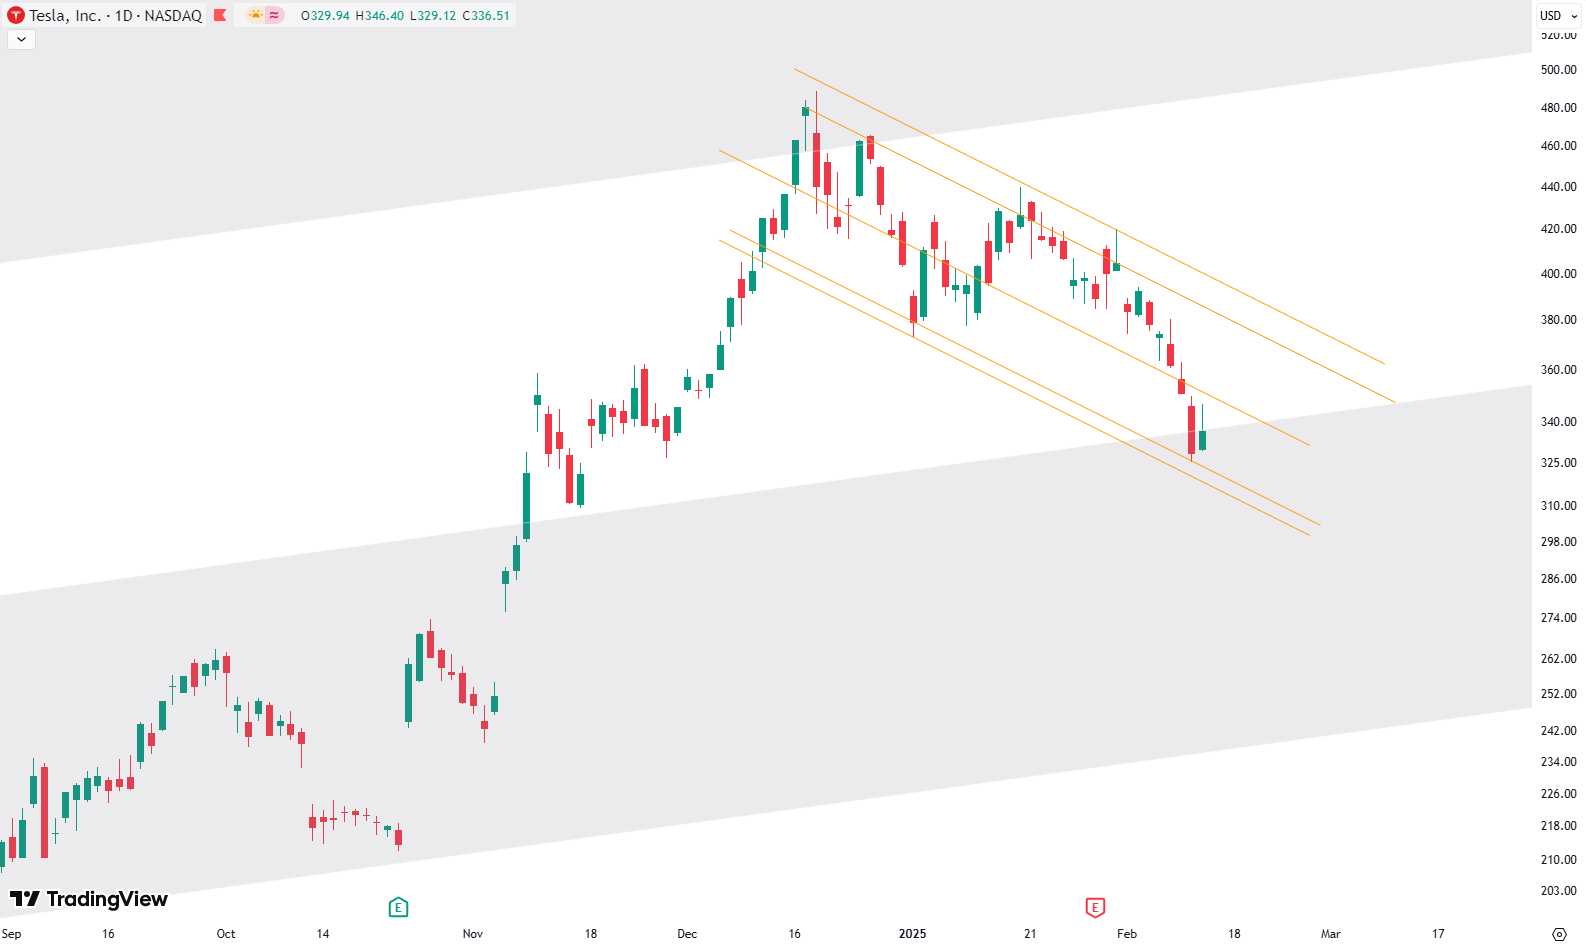
Zooming Into the Daily Chart
Switching to the daily chart, the picture becomes even clearer. Since October last year, Tesla had a massive 130% rally, climbing right into the upper gray resistance area. After such a strong run, some kind of pullback was expected, and that’s exactly what’s happening now.
Tesla is currently down about 30% from its peak and has entered the lower gray support zone. Historically, this has been an area where price finds some stability before reversing higher.
Another important pattern on the daily chart is a downward-sloping trend channel, marked by orange trend lines. This pattern is typically bullish, meaning that once the price reaches the lower range, a reversal is likely. However, there’s always a possibility that it could drop further before finding support.
Where Could Tesla Go From Here?
Looking at the bigger picture, this correction seems to be a natural part of Tesla’s long-term uptrend. While further downside is possible, the key level to watch is the lower gray support zone. If the stock finds support here and starts forming higher lows and higher highs, it could signal the end of the pullback and a potential new uptrend.
Investors should keep an eye on price action over the next few weeks to see if a reversal pattern starts forming. For those looking for more expert insights, there are ways to stay updated with key signals and market trends.
For now, Tesla’s long-term trend remains intact, and this pullback may just be another step in its overall climb.
The world of finance can be complex, with many technical terms. For explanations of financial terminology, try using the Investopedia dictionary.
Leave a Reply