
The S&P 500 had an impressive week, gaining 1.5% as it maintained its recent bullish momentum. Examining the 4-hour chart (with each candle representing 4 hours), we saw significant action unfold. After some volatility early in the week, the index finished on a strong note heading into Friday.
The last two weeks have been especially remarkable, with the S&P 500 delivering a solid 6% gain overall. These movements not only reflect strength but also highlight the renewed confidence in the market. This sharp rally has drawn attention, as it continues to test key levels with conviction.
Our last position, which we placed on November 20, has been active until December 10, when we sold it for a gain of 5.7%
Are you wondering when to buy the S&P 500 as an investor? Explore our tailored services and join our growing community of do-it-yourself investors who have successfully navigated the market with our guidance.
Premium Guide
Advanced Investing Signals
Basic Guide
Basic Investing
Signals
Simple Guide
Selected
Signals
Congratulations! You’ve discovered your new free financial guide. Simply sign up for our most popular service, our Simple Guide.
Breaking Resistance: What’s Next?
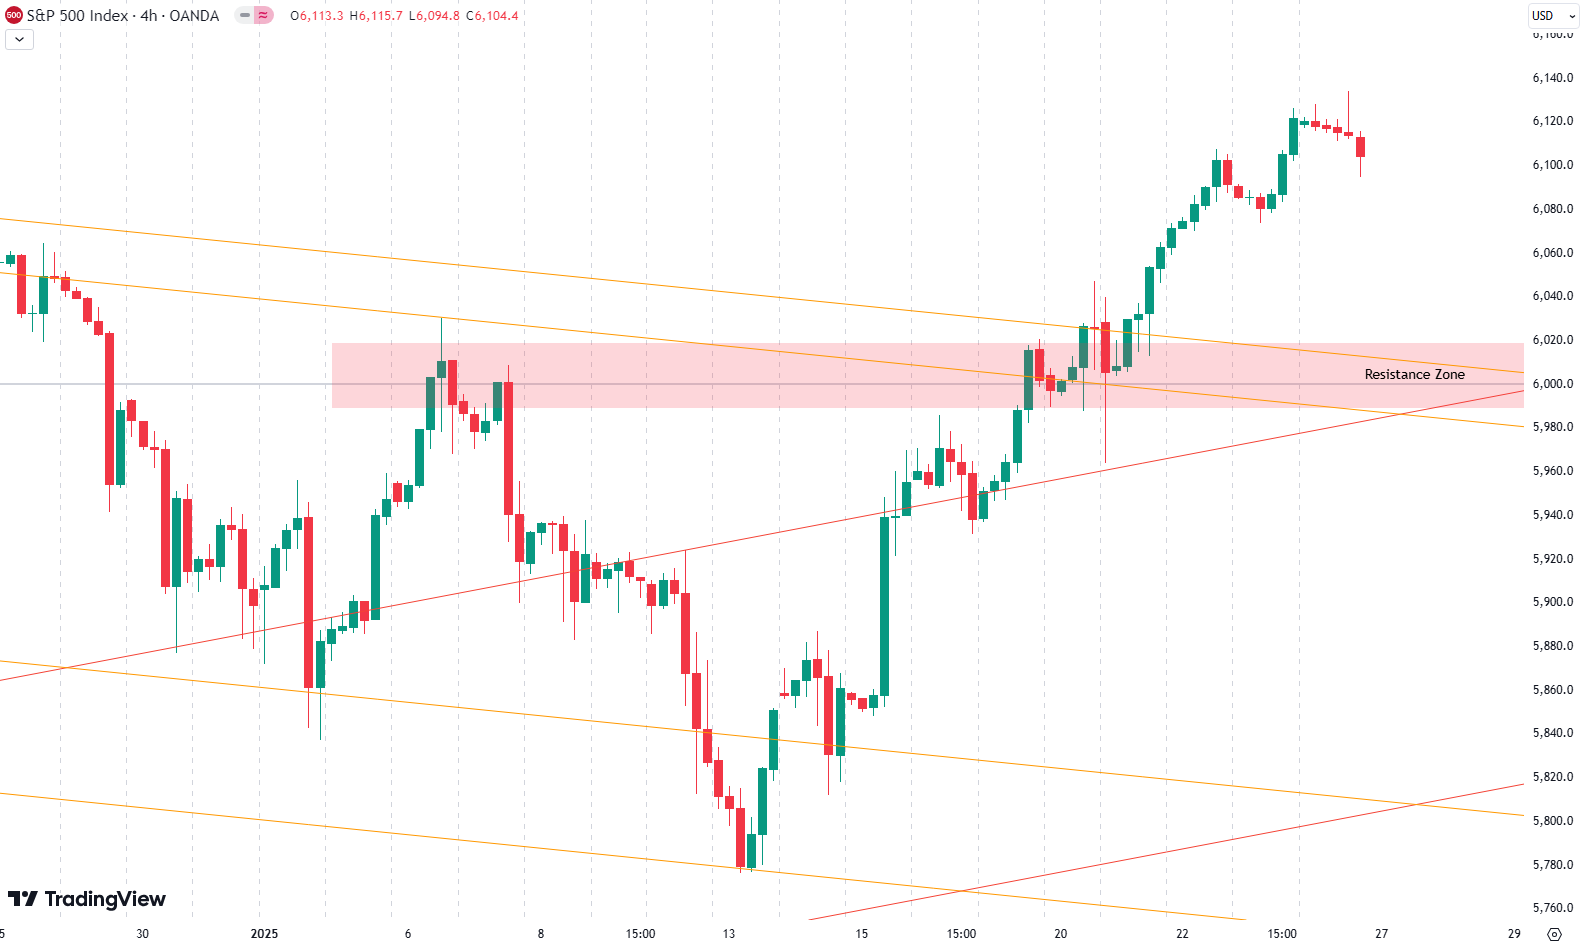
Zooming out to the daily chart, we can see the S&P 500 breaking through a critical resistance zone around the 6,000-point mark. This zone had been highlighted as crucial in previous discussions. It aligns with downward-sloping trend lines on the chart, and the breakout was swift despite some initial volatility.

However, on a short-term basis, the S&P 500 looks overbought. A slight pullback to retest previous highs from the correction is possible next week. For example, we might revisit 6,000 points briefly before another attempt to climb higher.
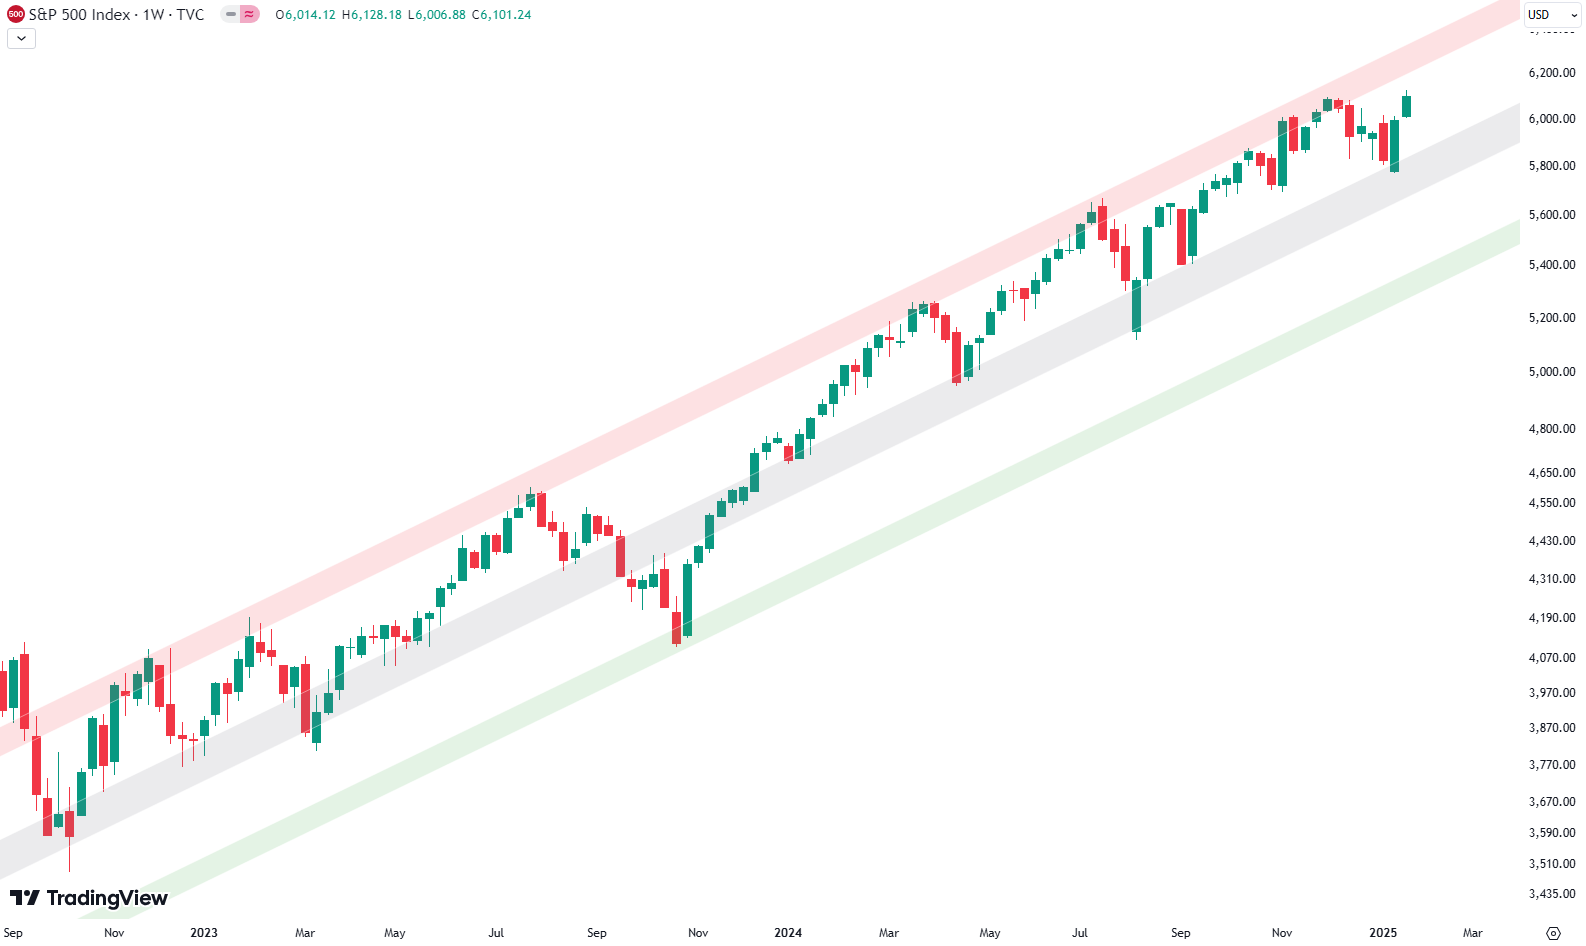
Switching to the logarithmic weekly chart, it’s clear the S&P has moved sharply after testing the grey shaded area. The upward momentum is driving it toward a red-shaded resistance zone. Approaching this area could suggest profit-taking opportunities or limited upside from here—but we’re not there yet.
For subscribers it is very important to follow our risk management measures that we provide with all our services to protect against losses in case support zones break
Next week promises to bring more action as the S&P tests resistance levels again. Stay prepared and manage risks effectively—our subscribers are well-equipped for this!
S&P 500: Seasonality Insights for Early 2025
Seasonality charts often provide helpful context for understanding market tendencies. Historically, the S&P 500 exhibits a choppy start to the year, with January and February experiencing turbulence that can extend into mid-March. This seasonal pattern suggests the potential for weakness in the coming weeks.
However, this type of analysis should always be approached cautiously. While seasonal trends indicate broad expectations, they cannot predict the future. Notably, last year saw significant deviations from typical patterns, with strength in the market that outpaced historical norms.
If seasonality holds true, this early choppiness might be followed by stabilization. Still, after the notable price increases seen in late 2024, investors should prepare for possible volatility and ensure proper risk management strategies are in place.
Ultimately, seasonal trends provide valuable context, but they must be considered alongside current market dynamics and technical analysis for a clearer picture. The S&P 500’s behavior during this critical time will reveal whether the seasonal weakness manifests or if the market defies expectations again.

Track Market Risk with Our Dashboard
Our Market Dashboard provides a quick overview of the current market conditions and, more importantly, the associated risk. You can view a chart of one of our tools, the Risk Level Indicator, showing predicted risk from 1998 to 2024. If you are interested, you can visit our Dashboard site here.

The world of finance is complex and includes many technical terms. For explanations of these terms, I recommend using the Investopedia dictionary.
Leave a Reply