
The gold miner ETF (GDX) has been moving within a well-established trend channel since 2015. Let’s break down the charts to understand where it might head next.
Monthly Chart: The Big Picture Since 2015
Looking at GDX’s monthly chart, we see a steady upward trend channel framed by a green area at the bottom (support), a red area at the top (resistance), and a gray zone in the middle (a balance point). These parallel lines have provided key levels for price movement for nearly a decade.
Each time prices dipped into the green shaded area, they found solid support, bouncing back upward. Conversely, prices meeting the red shaded area at the top faced resistance, leading to pullbacks. The gray middle line serves as a balance area where prices frequently pause, finding temporary resistance or support.

Are you wondering when to buy GDX as an investor? Explore our tailored services and join our growing community of do-it-yourself investors who have successfully navigated the market with our guidance.
Premium Guide
Advanced Investing Signals
Basic Guide
Basic Investing
Signals
Simple Guide
Selected
Signals
Congratulations! You’ve discovered your new free financial guide. Sign up for our most popular service, the Simple Guide.
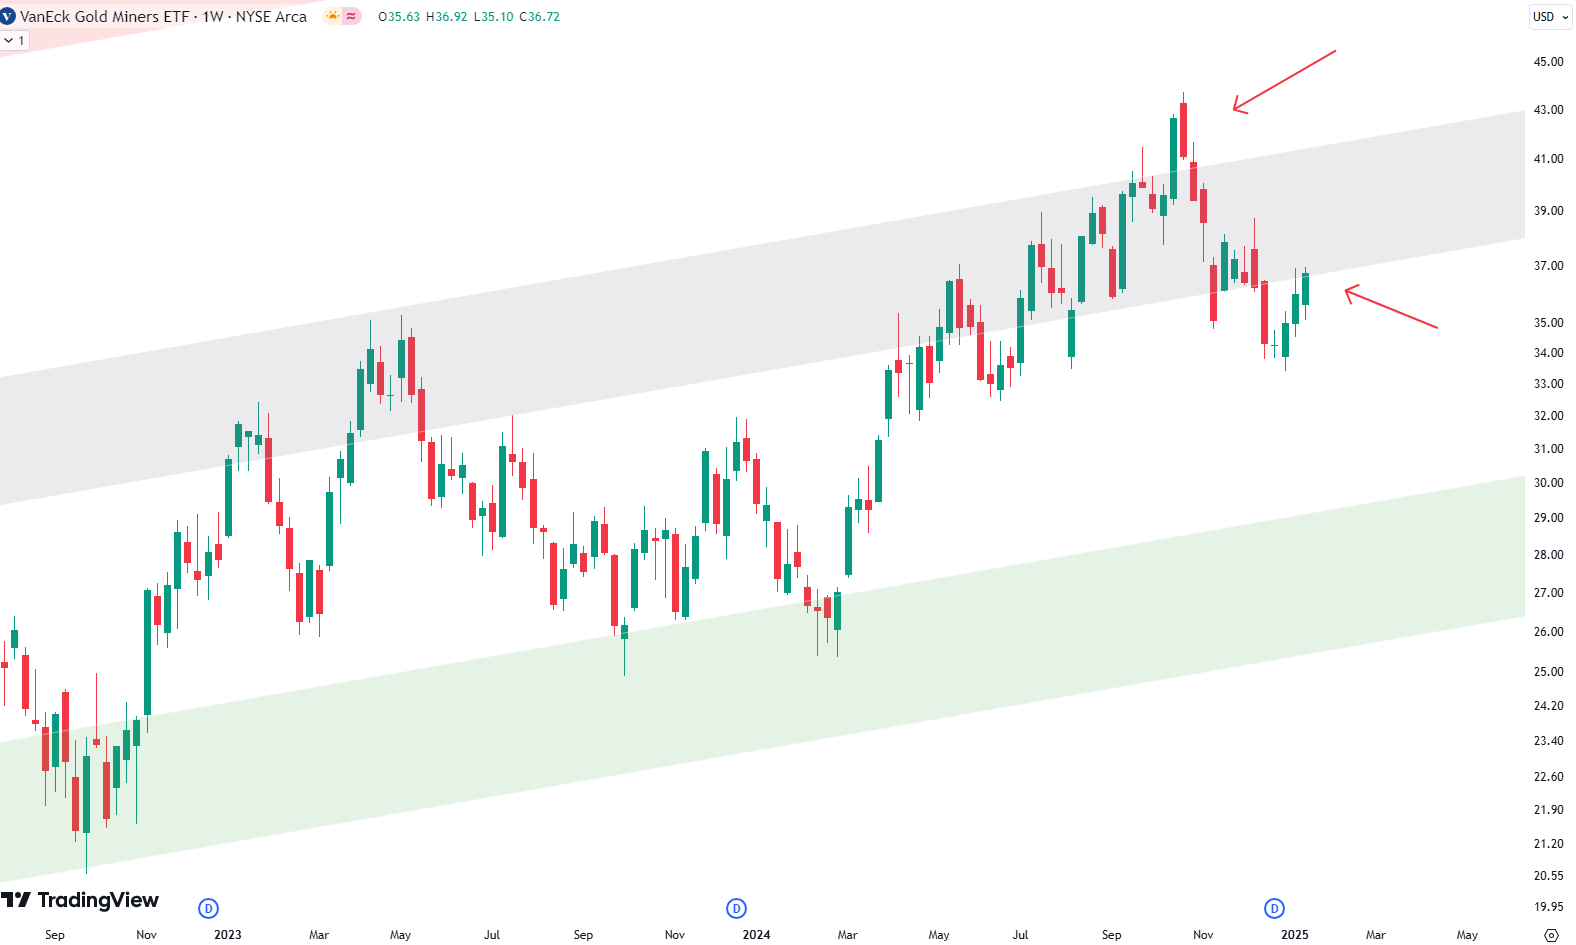
Weekly Chart: A Closer Look at Recent Action
Zooming into the weekly chart since late 2022, GDX recently bounced twice from the green shaded area, demonstrating strong support around these levels. The first bounce in late 2022 saw prices climb to the gray shaded area in mid-2023, where they hit resistance and pulled back.
Another bounce in 2024 again lifted prices toward the gray area, peaking above it briefly before falling back through. The price is now testing the gray shaded area from below, which might act as resistance again—a classic backtest. If the gray zone holds as resistance, the next target could be the green shaded area below.
What’s Next for GDX?
Based on the technical patterns, if the gray area proves to be strong resistance, further downside may be in store for GDX in the coming months, possibly testing the green shaded support area once more.
This setup emphasizes the importance of monitoring key levels within the trend channel. GDX investors might need to prepare for potential price fluctuations as the ETF interacts with these critical zones.
The world of finance can be complex, with many technical terms. For explanations of financial terminology, try using the Investopedia dictionary.
Leave a Reply