
This week’s S&P 500 saw a minor decline of 0.7%. Losses persisted through the first half, with Monday through Wednesday marking gradual declines. However, Friday offered a promising recovery, as the index rose by 1.5%, closing just shy of critical levels.
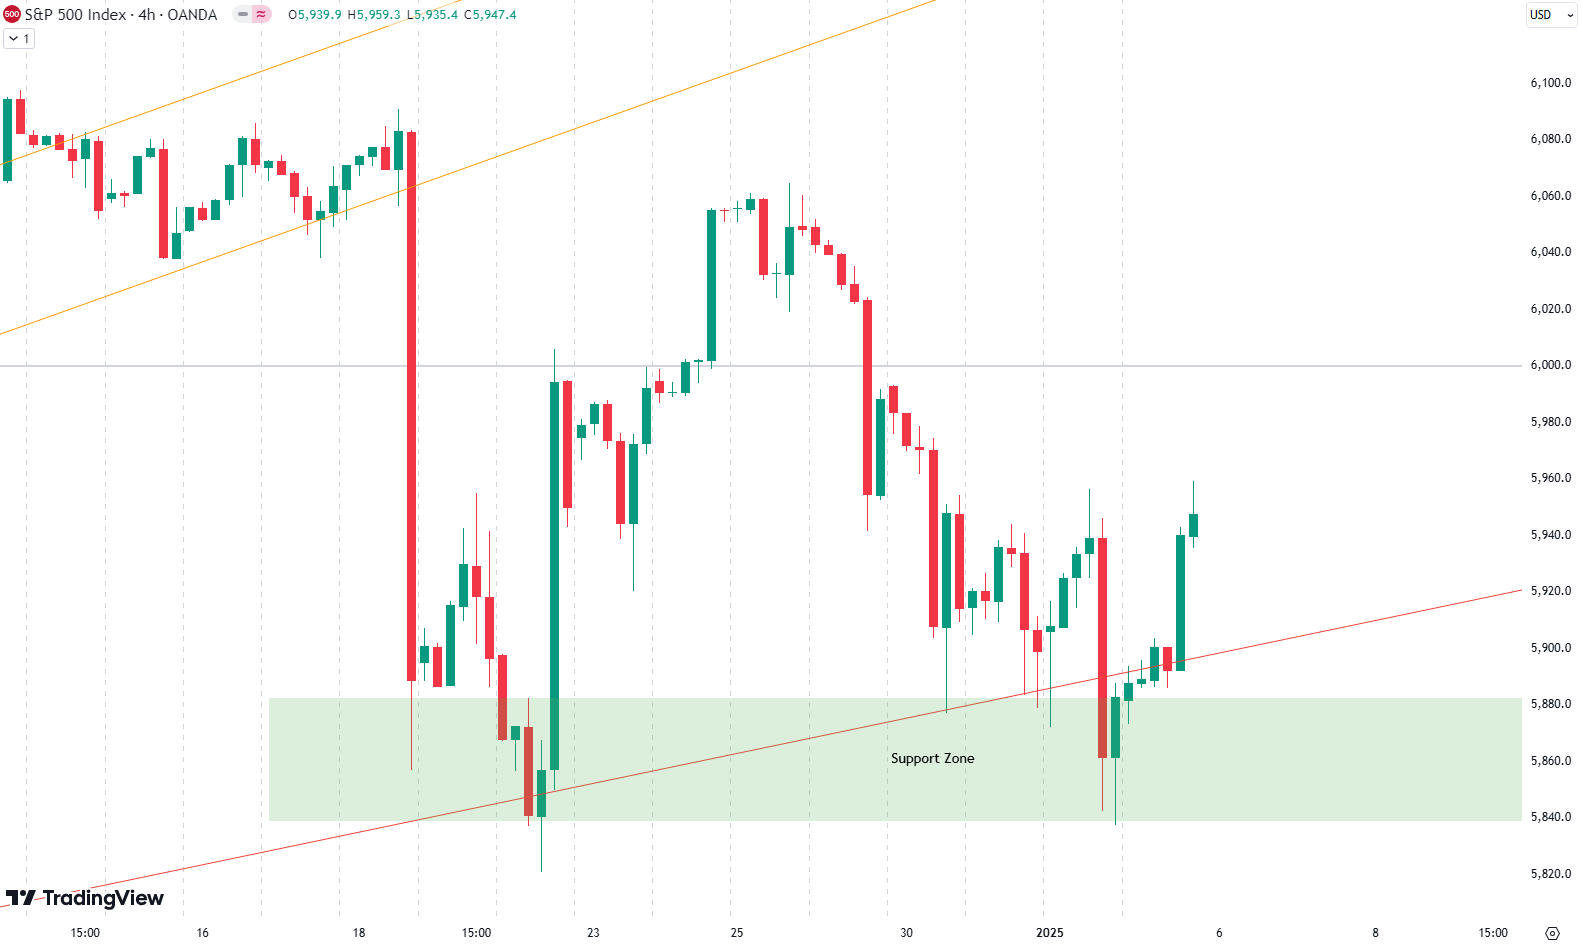
Reviewing the 4-hour chart, we observe the December 18th downturn initiating a corrective phase. Since then, the S&P 500 has twice tested the green support zone and red trend line from the weekly chart. These lines have been essential in marking resistance and support during this period. Crucially, the 6000-point mark remains a pivotal threshold, having resisted upward momentum on multiple occasions.
Our last position, which we placed on November 20, has been active until December 10, when we sold it for a gain of 5.7%
Are you wondering when to buy the S&P 500 as an investor? Explore our tailored services and join our growing community of do-it-yourself investors who have successfully navigated the market with our guidance.
Premium Guide
Advanced Investing Signals
Basic Guide
Basic Investing
Signals
Simple Guide
Selected
Signals
Congratulations! You’ve discovered your new free financial guide. Simply sign up for our most popular service, our Simple Guide.
The S&P 500 Resistance Battle
On the daily chart, the S&P 500’s movements since September show a steady uptrend held in place by an orange trend line. However, this was disrupted by a sharp drop in December. Prices fell into the green support zone before bouncing back, as they did the last two weeks, only to be rejected at the orange trend line, marked by a red arrow on the chart.
This rejection pushed prices back down to the green support zone, but Friday’s rally has signaled that the zone may remain intact as solid support. What’s crucial here is that, despite climbing back to levels seen two weeks ago, the index still hasn’t made a new all-time high. This hints at underlying weakness, even if Friday’s rebound seems encouraging for now.
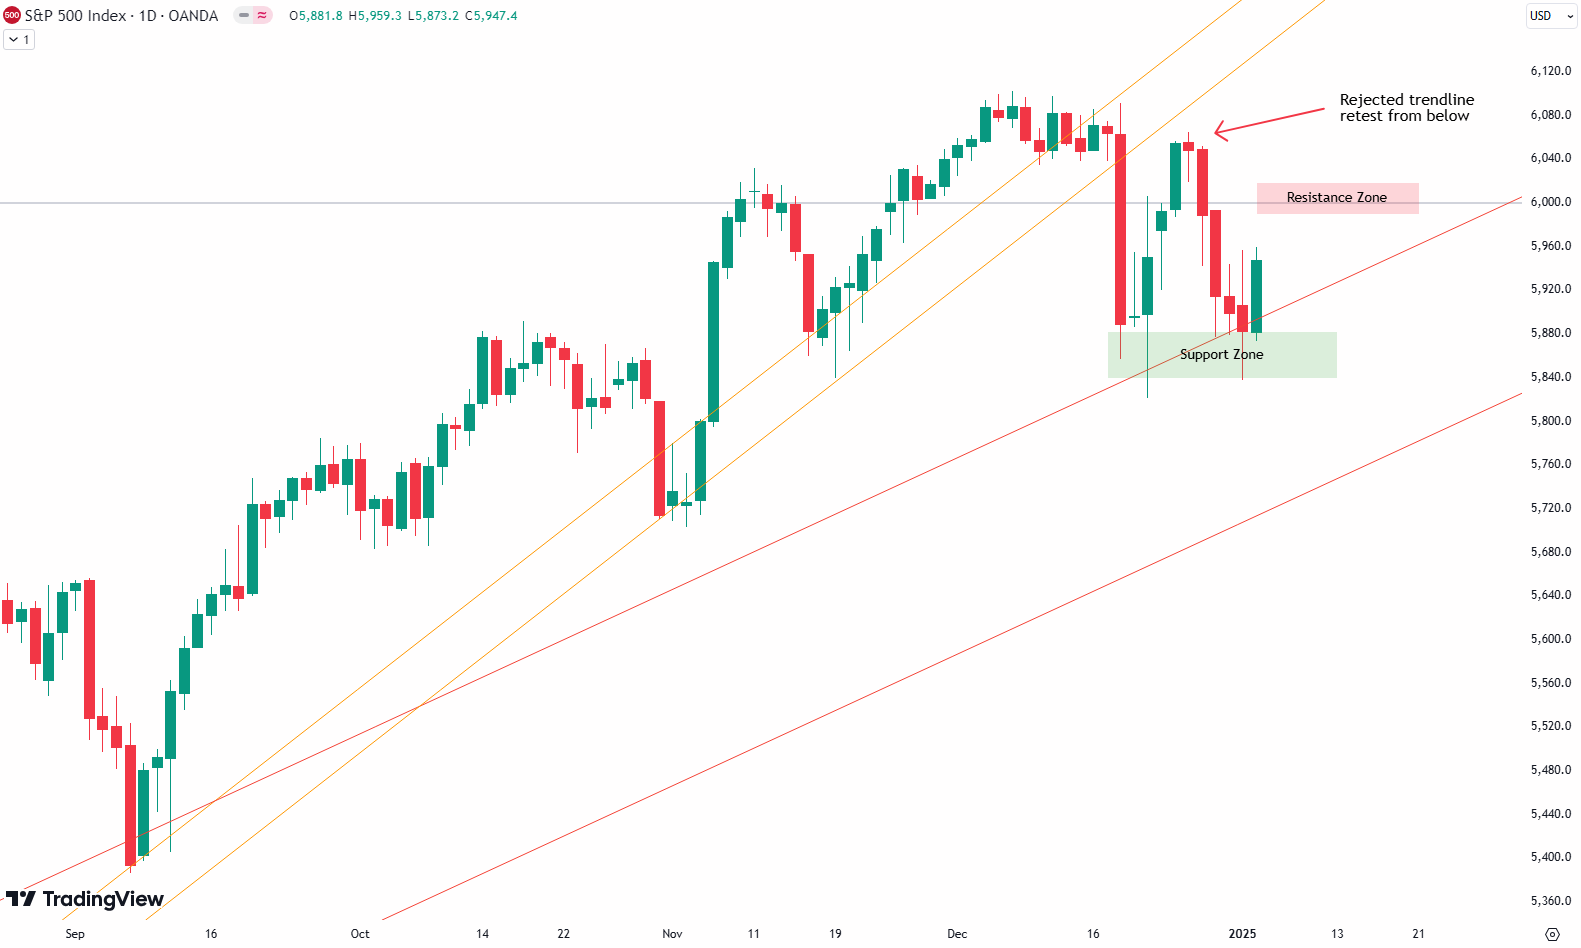
The key focus remains on the red resistance zone, located near the 6000-point level. This zone has consistently acted as both support and resistance in the past. For the market to reach new highs, it must break above this level, find support there, and sustain upward momentum. Previous attempts to surpass this zone led to pullbacks, making it pivotal for future movements.
Additionally, the green support zone intersects with the red trend line from the weekly chart, an area historically strong in offering support. The battle at this intersection will likely define the direction in the weeks ahead.
For subscribers it is very important to follow our risk management measures that we provide with all our services to protect against losses in case support zones break
S&P 500: Seasonality Insights for Early 2025
Seasonality charts often provide helpful context for understanding market tendencies. Historically, the S&P 500 exhibits a choppy start to the year, with January and February experiencing turbulence that can extend into mid-March. This seasonal pattern suggests the potential for weakness in the coming weeks.
However, this type of analysis should always be approached cautiously. While seasonal trends indicate broad expectations, they cannot predict the future. Notably, last year saw significant deviations from typical patterns, with strength in the market that outpaced historical norms.
If seasonality holds true, this early choppiness might be followed by stabilization. Still, after the notable price increases seen in late 2024, investors should prepare for possible volatility and ensure proper risk management strategies are in place.
Ultimately, seasonal trends provide valuable context, but they must be considered alongside current market dynamics and technical analysis for a clearer picture. The S&P 500’s behavior during this critical time will reveal whether the seasonal weakness manifests or if the market defies expectations again.

Track Market Risk with Our Dashboard
Our Market Dashboard provides a quick overview of the current market conditions and, more importantly, the associated risk. You can view a chart of one of our tools, the Risk Level Indicator, showing predicted risk from 1998 to 2024. If you are interested, you can visit our Dashboard site here.

The world of finance is complex and includes many technical terms. For explanations of these terms, I recommend using the Investopedia dictionary.
Leave a Reply