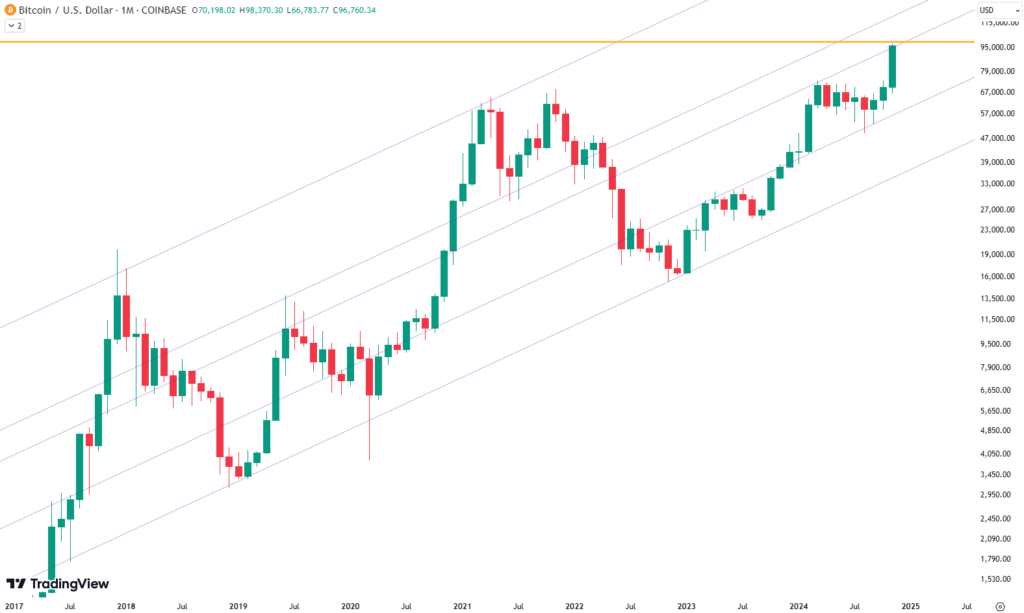
Bitcoin has been on a tear recently, gaining an impressive 45% since the beginning of November. For those new to cryptocurrency investing, this explosive move may seem sudden, but the charts tell a fascinating story of persistence, resistance, and eventual breakout.
Tracking Bitcoin’s Journey: A Look at the Daily Chart
The daily Bitcoin chart reveals key trends and movements. For most of the year, prices were held down by the downward-sloping red trend line, acting as a resistance level. This trend line had confined Bitcoin’s price since March, forcing it to move sideways without breaking higher.
Back in October, we warned that Bitcoin was nearing this red trend line, signaling potential consolidation or a pullback. And as expected, Bitcoin briefly pulled back after reaching this resistance level.
What happened next was a textbook technical breakout in action. Bitcoin broke through the red trend line and closed above it for several days. After this breakout, the price dipped slightly, retesting the former resistance—which had now turned into support—before skyrocketing higher.
This pattern, where resistance becomes support, is a classic sign of strength in price action. Bitcoin climbed from $68,000 to $98,000, and it now looks poised to test the psychological barrier of $100,000.

Are you wondering when to buy Bitcoin as an investor? Explore our tailored services and join our growing community of do-it-yourself investors who have successfully navigated the market with our guidance.
Premium Guide
Advanced Investing Signals
$139 / Month
Basic Guide
Basic Investing
Signals
$49 / Month
Simple Guide
Selected
Signals
Free
Congratulations! You’ve discovered your new free financial guide. Sign up for our most popular service, the Simple Guide.
Why $100,000 Matters
Round numbers like $100,000 carry psychological significance in markets. Many traders view them as milestones or natural points of resistance. As Bitcoin approaches this mark, some consolidation or sideways movement is expected.
Looking at Long-Term Trends
Beyond the recent surge, a purple trend line stretching back to 2017 is also coming into play. This long-term trend line has historically interacted with Bitcoin’s price and may act as resistance in the near future. As Bitcoin enters the range between the next two purple trend lines, volatility may increase.

What’s Next for Bitcoin?
While the recent rally has been impressive, caution is warranted. A prolonged correction earlier this year created the conditions for a strong breakout, and such moves can often continue longer than expected. However, resistance levels and consolidation phases are natural parts of price growth.
Summary
Bitcoin’s breakout past the red trend line has marked a significant turning point in its price trajectory. With $100,000 within reach, the cryptocurrency faces its first major resistance in this rally. Long-term investors and traders alike should watch how Bitcoin navigates these critical levels.
The world of finance can be complex, with many technical terms. For explanations of financial terminology, try using the Investopedia dictionary.

Leave a Reply