
Welcome to our weekly newsletter on the S&P 500. This week, the S&P 500 experienced a loss of 0.8%. The sell-off that began Wednesday last week persisted into this week. Small relief rallies on Monday and Tuesday were followed by further declines on Wednesday and Thursday. However, another relief rally on Friday may indicate that buyers are starting to return to the market. We will closely monitor next week’s movements to see if this trend continues.

Our last position, placed on July 18th, is currently up by 5.7%.
Are you wondering when to buy the S&P 500 as an investor? Explore our tailored services and join our growing community of do-it-yourself investors who have successfully navigated the market with our guidance.
Premium Guide
Advanced Investing Signals
$139 / Month
Basic Guide
Basic Investing
Signals
$49 / Month
Simple Guide
Selected
Signals
Free
Congratulations! You’ve discovered your new free financial guide. Simply sign up for our most popular service and our Simple Guide.
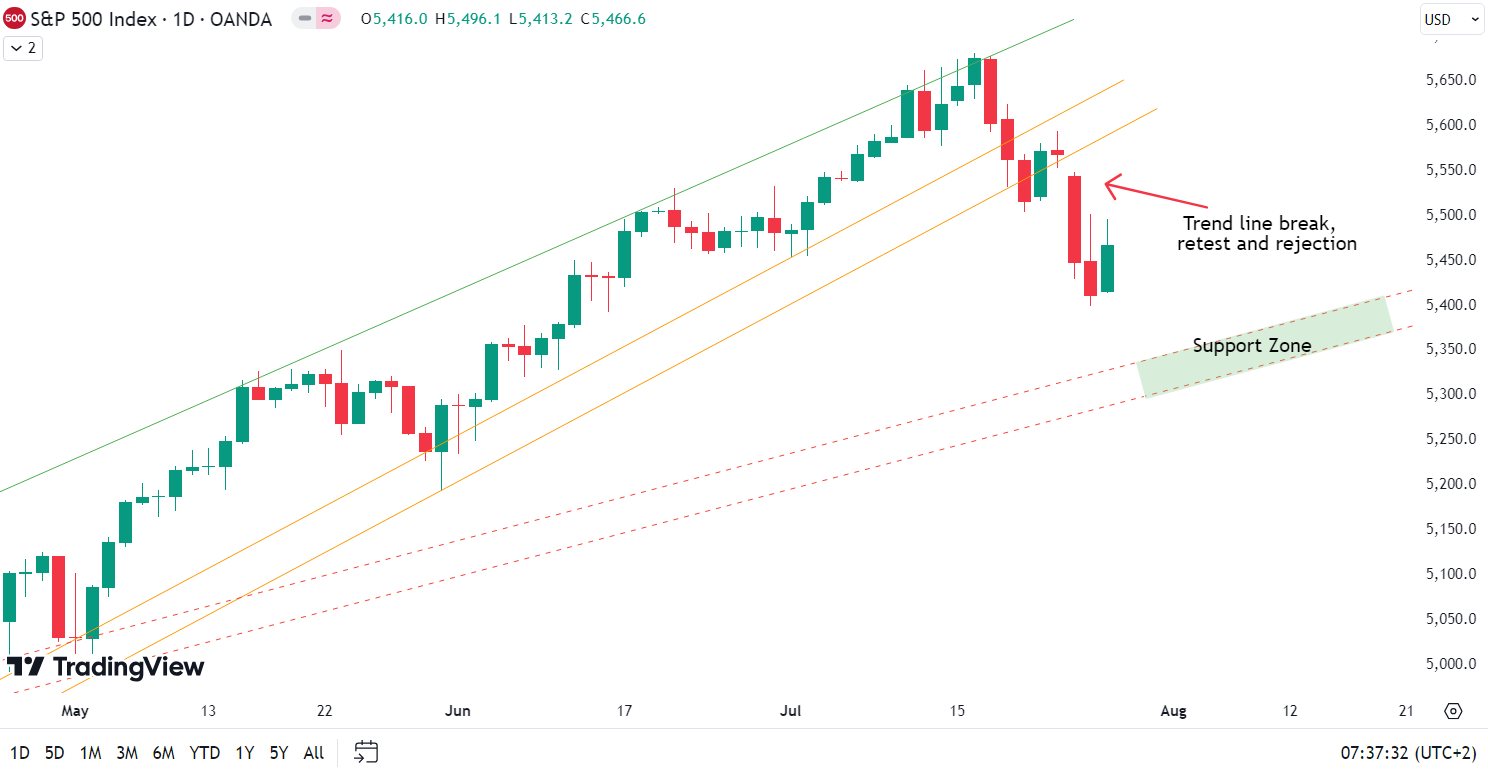
Since the July top, the S&P 500 is down 3.7%. After losses in recent weeks, further declines continued this week. Last week, we mentioned that the index was at a critical point because it broke the two orange trend lines on Friday. We also expected a short-term bounce. This bounce occurred, with the S&P 500 retesting those trend lines from below on Monday and Thursday. However, it was rejected by the now-resistance orange trend lines and dropped further by the end of the week. Our downside target is now the green support zone visible on the chart. Moving averages, trend lines, and horizontal support converge here, creating a very strong support zone. At least a short-term bounce can be expected from this area. If the index reaches this zone, it will have declined 6% from the top, aligning with our expectation of a 5-10% correction. This decline helps to reduce the overbought conditions we’ve discussed in recent weeks. Consequently, risk-reward ratios are becoming favorable again. Because of this, we will look for opportunities to enter long positions if we see positive price action in the support zone. For subscribers, it is very important to follow our risk management measures that we provide with all our services to protect against losses in case support zones break. We will continue to monitor the market for new opportunities and keep you updated.
The next few months
The chart shows the seasonality for the S&P 500 in an election year, indicating anticipated weakness in May, June, and July, followed by strong price increases until early September. This is then followed by a larger correction until the election in early November. From mid-June to the end of July, seasonality suggests some weakness and only moderate price rises, which we have certainly experienced with the recent decline. Now we enter August, which seasonality suggests is the strongest month of the year with an average gain of 3%. Of course, seasonality data should be taken cautiously, especially this year, as we have already seen a significant rise in prices. Investors should consider both seasonality trends and our analysis for a balanced view. Proper risk management is essential in navigating these market conditions.

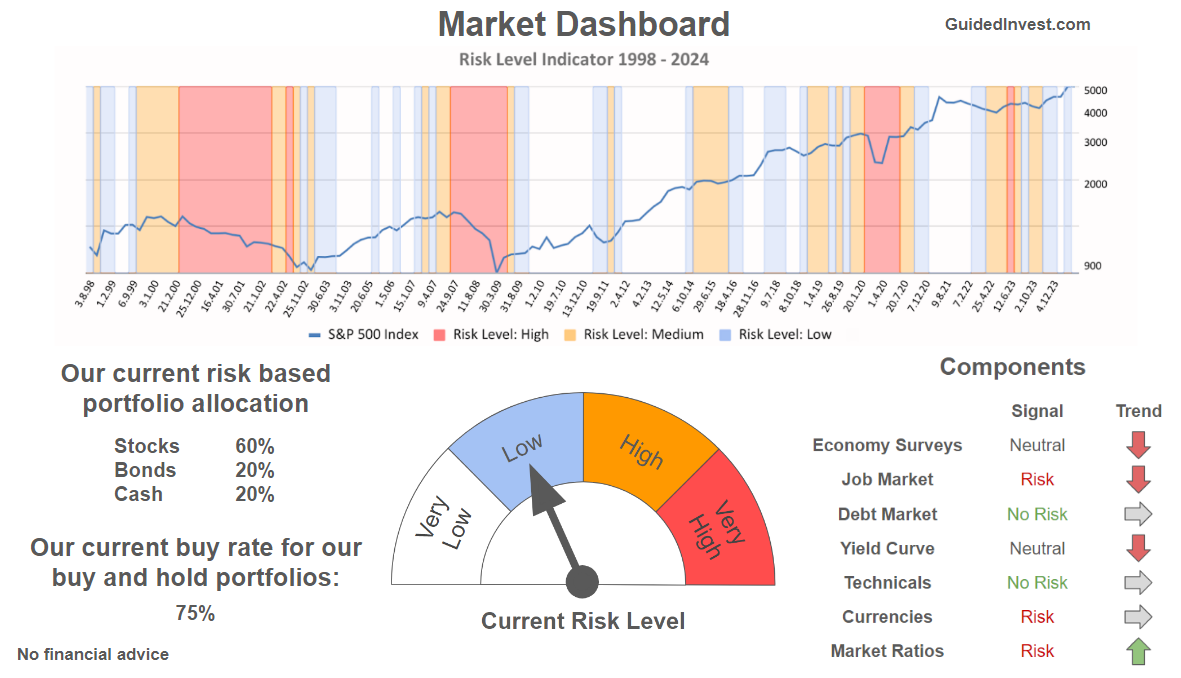
Our Market Dashboard provides a quick overview of the current market conditions and, more importantly, the associated risk. You can view a chart of one of our tools, the Risk Level Indicator, showing predicted risk from 1998 to 2024. If you are interested, you can visit our Dashboard site here.
The world of finance is complex and includes many technical terms. For explanations of these terms, I recommend using the Investopedia dictionary.
Leave a Reply