
Welcome to our weekly newsletter on the S&P 500. This week, the S&P 500 experienced a loss of 1.9%. After some gains on Monday and Tuesday, the week was dominated by strong sell-offs on Wednesday, Thursday, and Friday. Our sell signals were triggered on Friday, prompting us to close our position that we’ve held since April 25th with a gain of 26.6%.
Our last position, which we placed on April 25th, has been active until July 19th, when we sold it for a gain of 26,6%
Are you wondering when to buy the S&P 500 as an investor? Explore our tailored services and join our growing community of do-it-yourself investors who have successfully navigated the market with our guidance.
Premium Guide
Advanced Investing Signals
$139 / Month
Basic Guide
Basic Investing
Signals
$49 / Month
Simple Guide
Selected
Signals
Free
Congratulations! You’ve discovered your new free financial guide. Simply sign up for our most popular service and our Simple Guide.
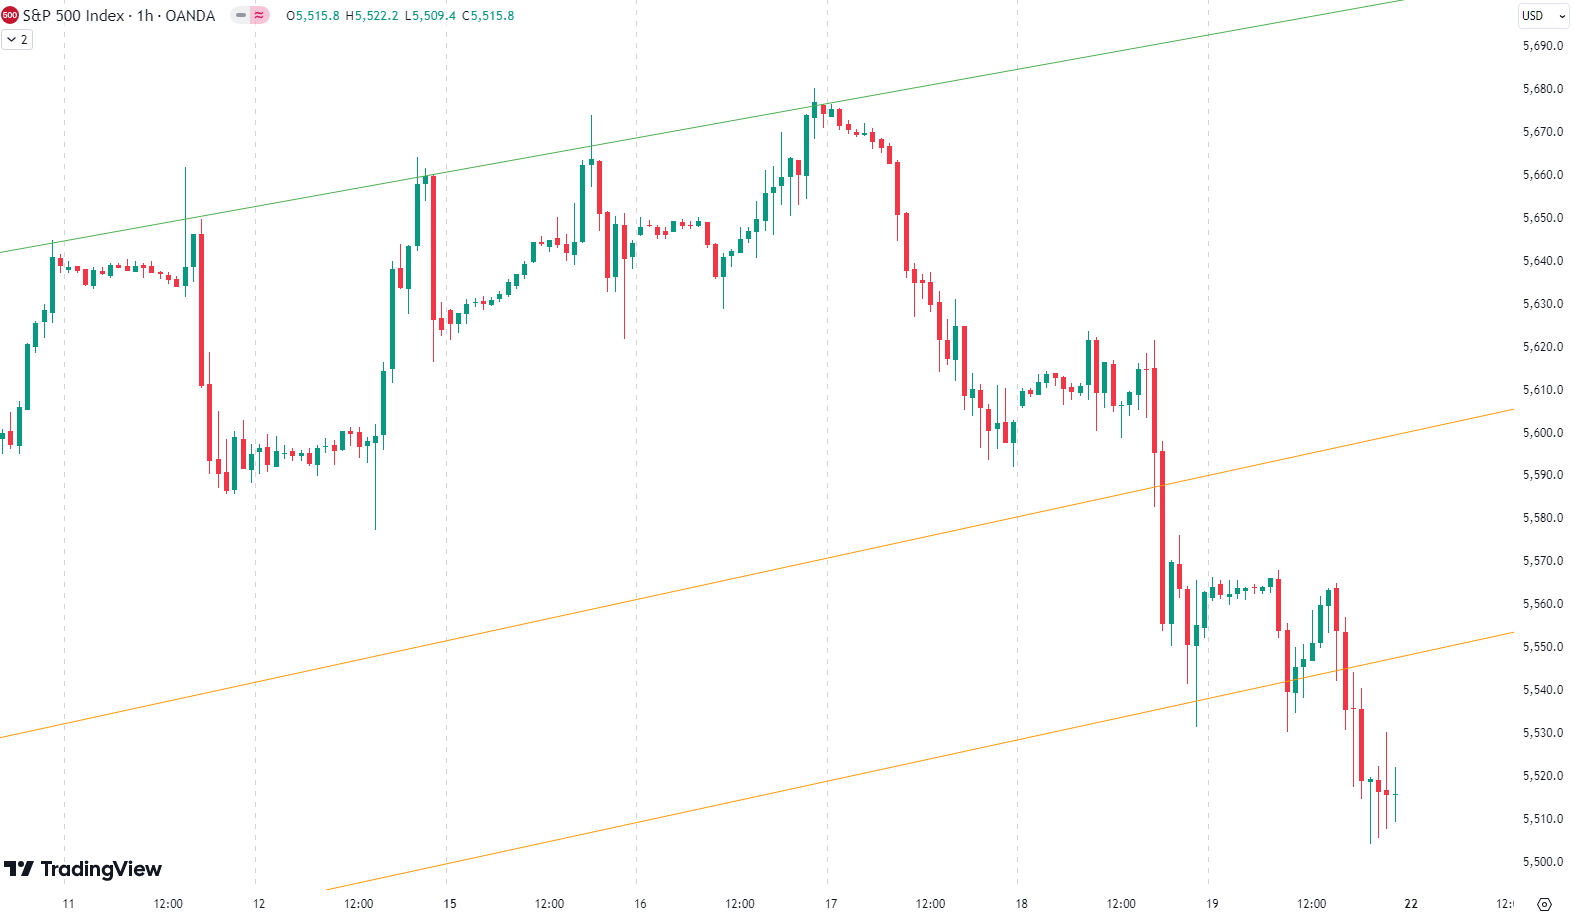
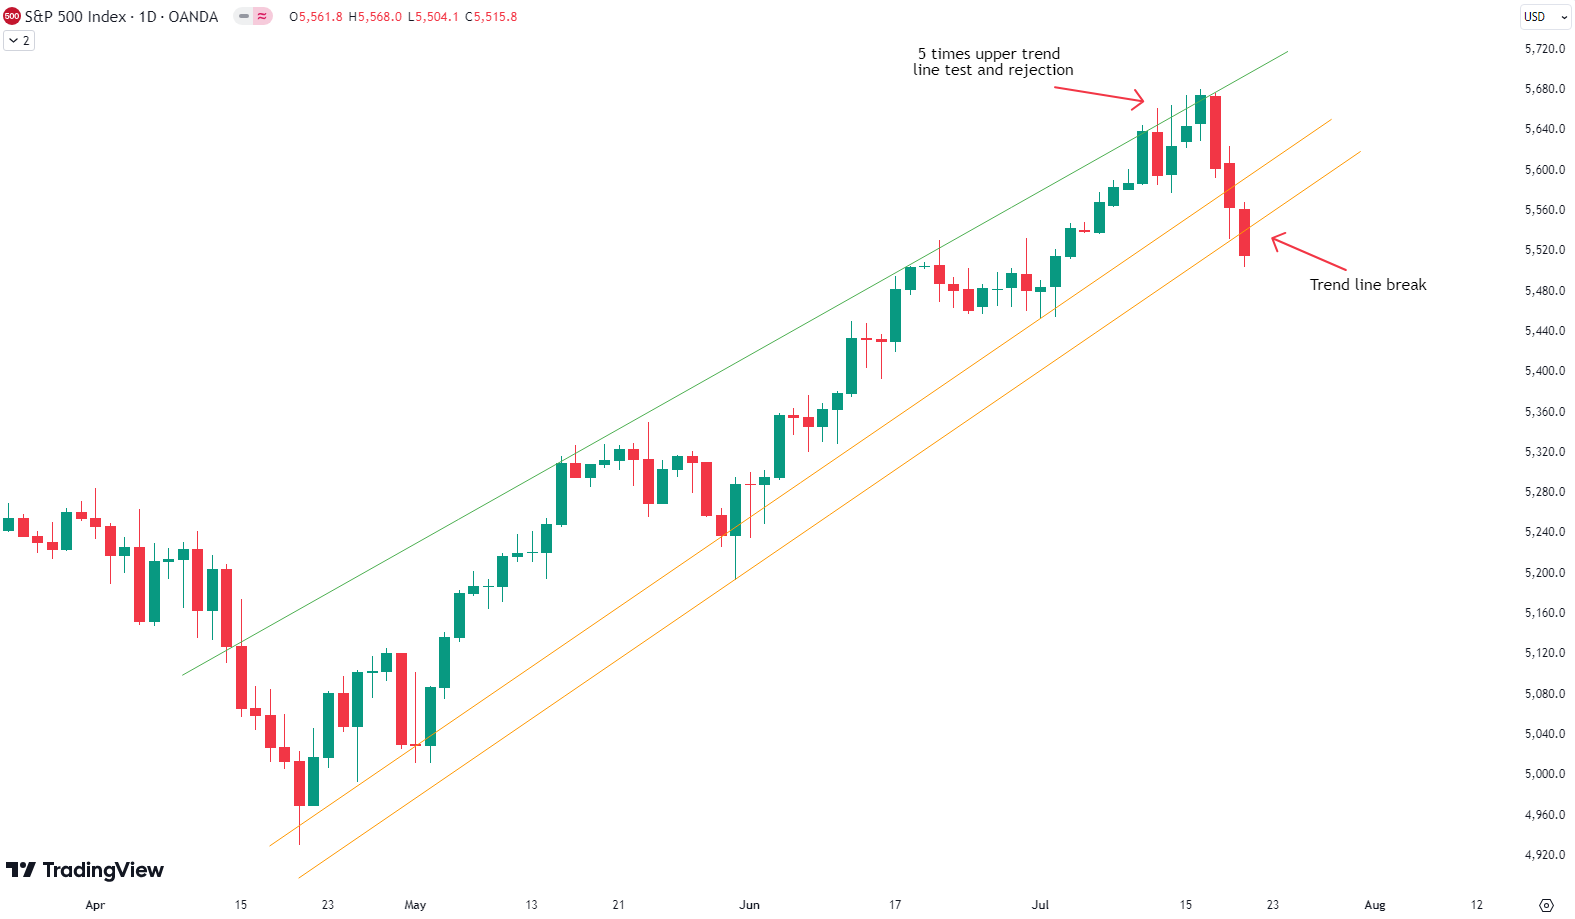
Since the April low, the S&P 500 is up 11,7%. After strong gains in previous weeks, this week saw some losses. Last week, we mentioned the green trend line that defines the uptrend on the upside since the April low. The index tested this green trend line for five consecutive days but was unable to overcome it. Then, within two days, the S&P 500 dropped about 2.5% to the lower range of the trend channel and tested the two orange trend lines we have frequently discussed. The rising wedge pattern we talked about last week has now, as expected, broken to the downside. The index is now at a very critical point; with Friday’s close, the two orange trend lines are now broken. It is possible that the S&P 500 bounces from here, as it is short-term oversold and at horizontal support. You could argue for buying here, but as we stated over the last few weeks, the overbought conditions on the longer time frames are not yet resolved, so the upside remains limited. We assume that the uptrend since April is now broken, and a larger correction (5-10%) is likely occurring. Due to the short-term oversold conditions, we expect a rally from here to retest the broken trend lines, where we may also deploy some short positions to hedge against the risk of a deeper downturn. For subscribers, it is crucial to follow our risk management measures that we provide with all our services to protect against losses in case support zones break.Follow us for updates and guidance on navigating these market conditions.
The next few months
On the chart, you can see the seasonality for the S&P 500 in an election year, which anticipates weakness in May and then strongly rising prices until early September. This is followed by a bigger correction until the election in early November. From mid-June to the end of July, seasonality suggests some weakness and only moderate rising prices. This fits very well with our current analysis of overextension to the upside and the probability of some pullback. Of course, the seasonality data should be taken cautiously, especially this year because we have already had a significant rise in prices. Investors should consider both seasonality trends and our analysis for a balanced view. Proper risk management is essential in navigating these market conditions.

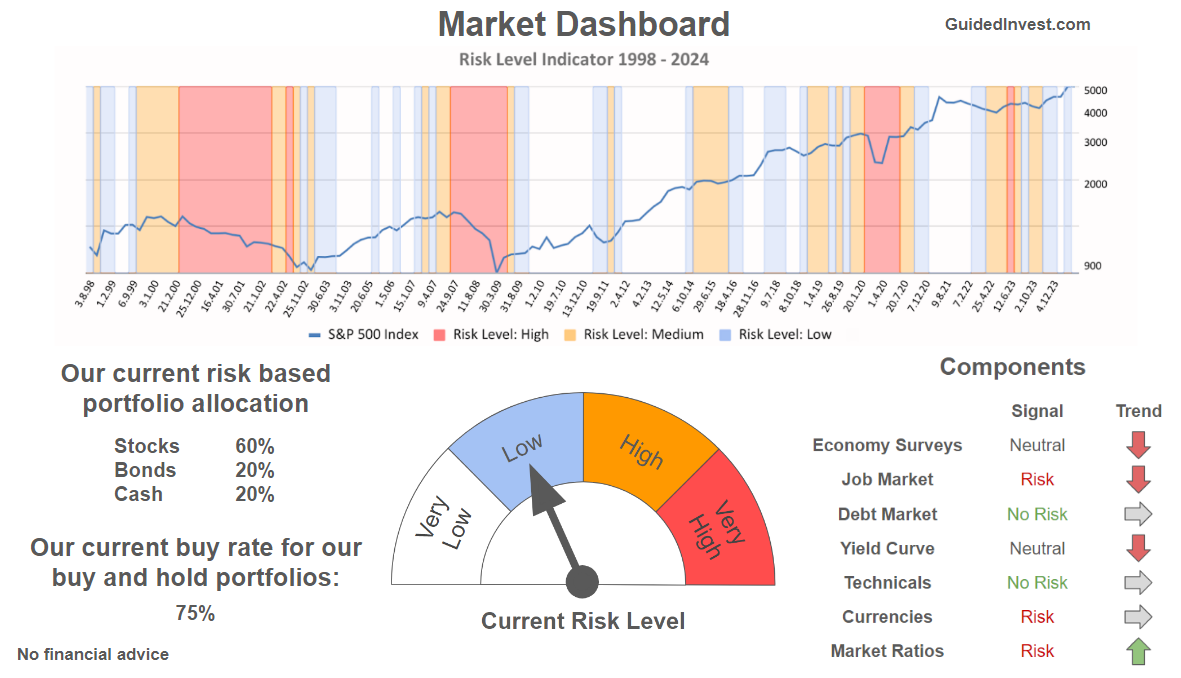
Our Market Dashboard provides a quick overview of the current market conditions and, more importantly, the associated risk. You can view a chart of one of our tools, the Risk Level Indicator, showing predicted risk from 1998 to 2024. If you are interested, you can visit our Dashboard site here.
The world of finance is complex and includes many technical terms. For explanations of these terms, I recommend using the Investopedia dictionary.
Leave a Reply