
We will analyze oil in this week’s article. After peaking at around $130 in 2022, oil crashed down 50% to $63 and bottomed in May of 2023. Since then, it has moved sideways within a range between $70 and $90.
Are you wondering when to buy Oil as an investor? Explore our tailored services and join our growing community of do-it-yourself investors who have successfully navigated the market with our guidance.
Premium Guide
Advanced Investing Signals
$139 / Month
Basic Guide
Basic Investing
Signals
$49 / Month
Simple Guide
Selected
Signals
Free
Get started and sign up for our Simple Guide
On the weekly chart, you can see a downward trend channel (red on the chart). In March this year, oil broke out of the trend channel and retested it in June. This breakout may be bullish for oil, indicating higher prices to come.
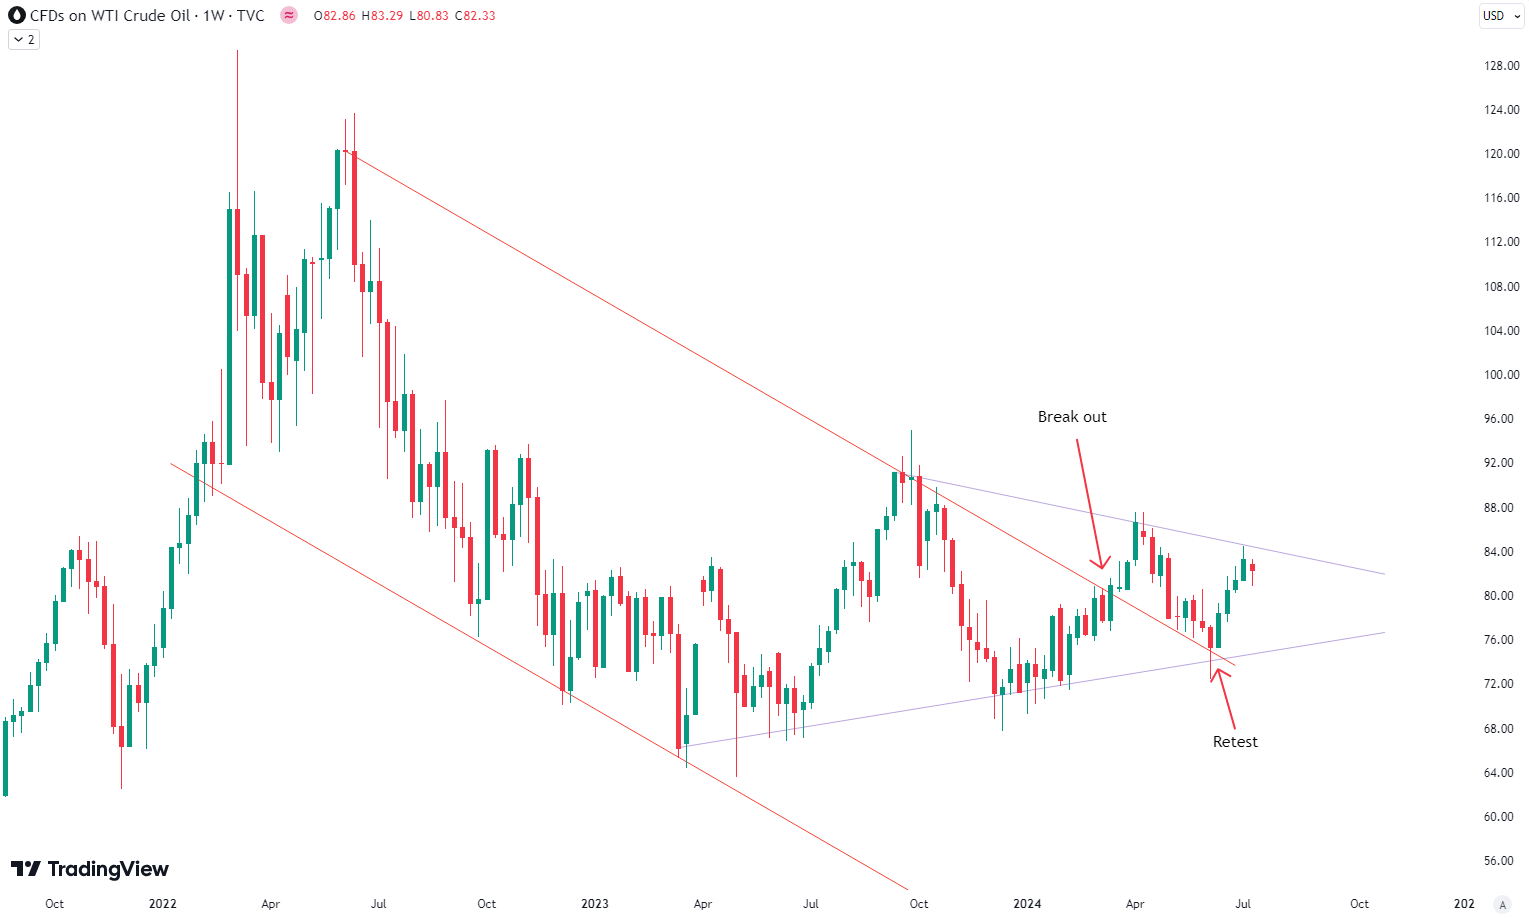
In addition to the breakout of the red trend channel, oil has formed a wedge pattern (purple on the chart). This pattern can further indicate the direction oil might take. If oil breaks the wedge pattern to the upside, it would certainly add to a bullish outlook and present a good opportunity. For subscribers, it is crucial to follow our risk management measures, which we provide with all our services, to protect against losses if support zones break. Follow us for updates and guidance on navigating oil market trends.
The world of finance is complex and includes many technical terms. For explanations of these terms, I recommend using the Investopedia dictionary.
Leave a Reply