
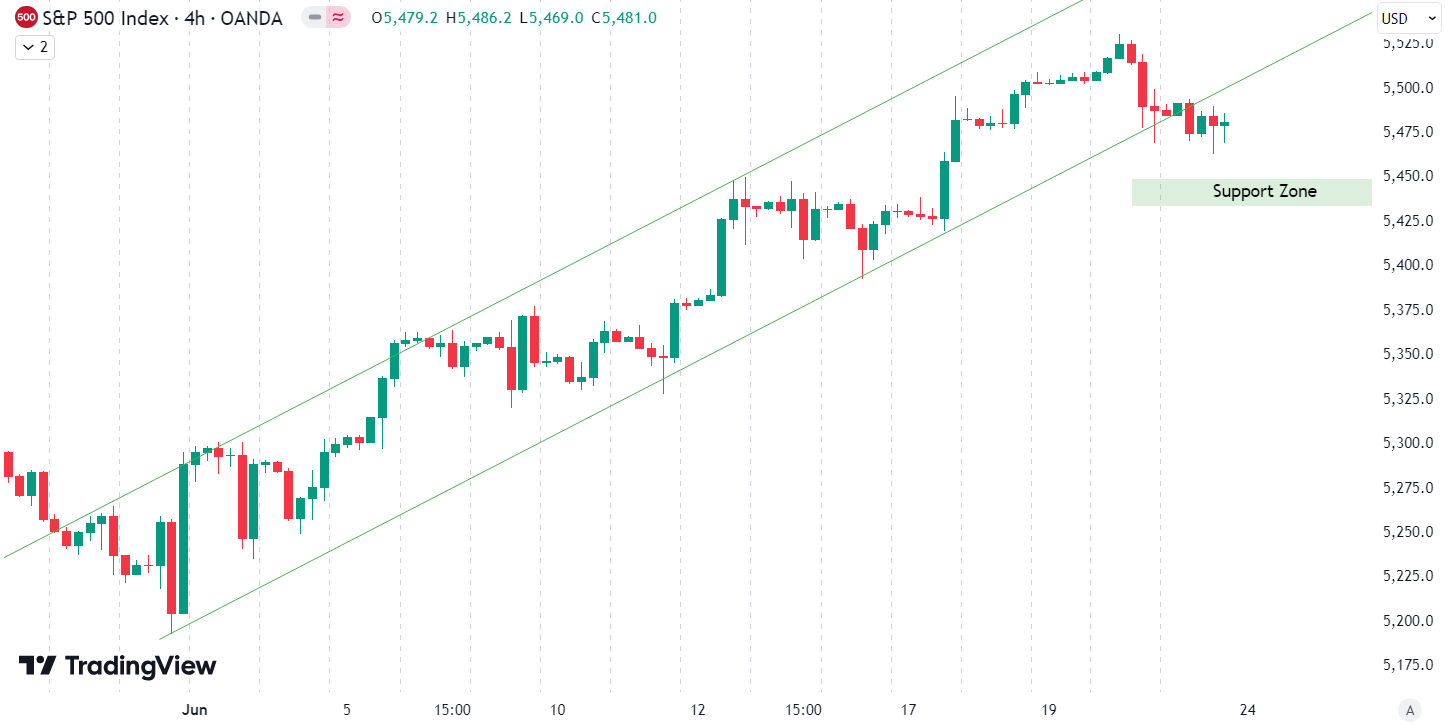
This week, the S&P 500 had a gain of 0.7%. The index rallied on Monday and Tuesday, but experienced moderate losses on Thursday. Last week, we wrote about an uptrend that had been established since the start of June (green on the chart). This uptrend channel was broken on Friday, indicating growing weakness in the market. Whether this is just another smaller correction or the beginning of a larger market downturn remains to be seen. The first support zone for the index is in the 5430 to 5450 points area. Investors should closely monitor this level. If the index holds this support, it could present a buying opportunity. However, a break below this zone could signal further downside.
Our last position which we placed has been active since April 25th. The position is currently up by 24,8%.
Are you wondering when to buy the S&P 500 as an investor? Explore our tailored services and join our growing community of do-it-yourself investors who have successfully navigated the market with our guidance.
Premium Guide
Advanced Investing Signals
$139 / Month
Basic Guide
Basic Investing
Signals
$49 / Month
Simple Guide
Selected
Signals
Free
Get started with our most popular service and sign up for our Simple Guide
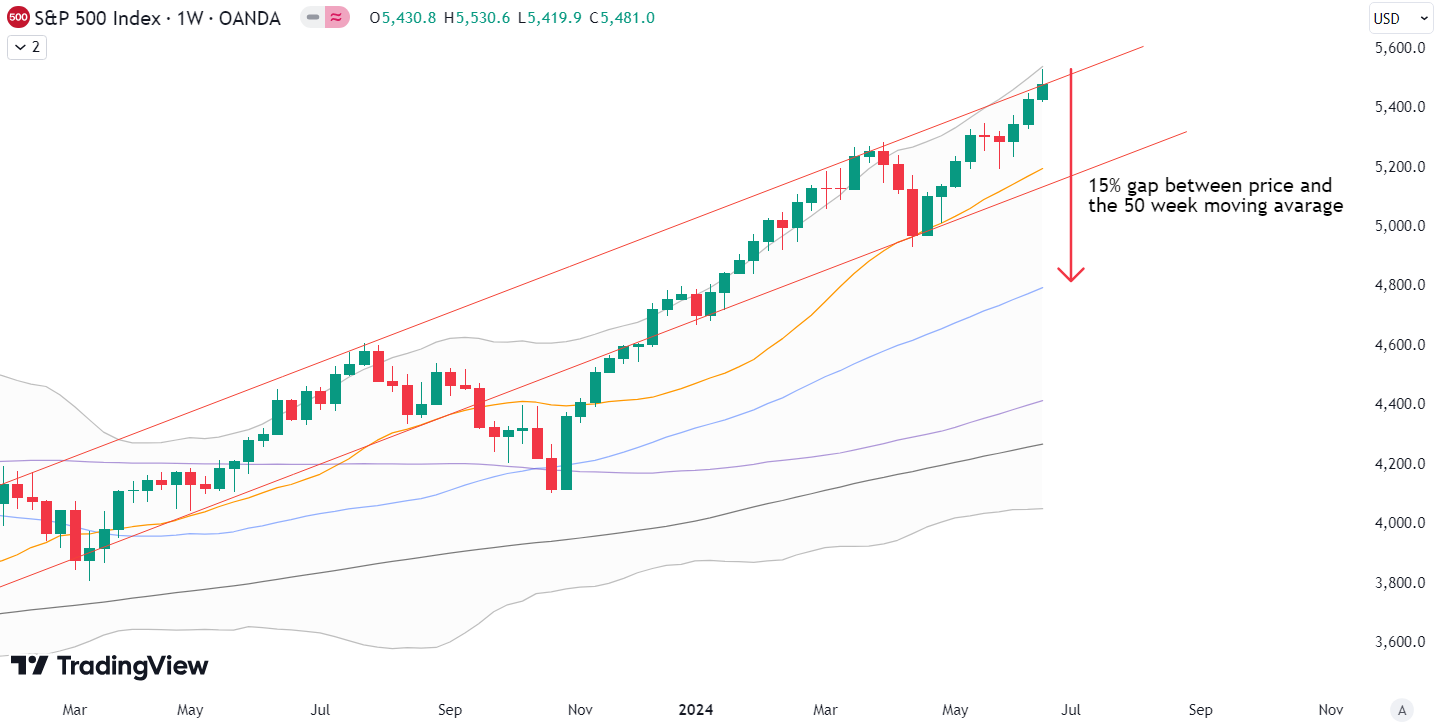
Since the April low, the S&P 500 is up 11.2%. The index had a strong move up in the last three weeks. The strong overbought conditions we discussed last week still persist on the monthly, weekly, and daily timeframes. This week, the index pushed over the long-term trend line (red on the chart), but fell below it at the end of the week. On Wednesday, the index had a 15% gap between current prices and the 50-week moving average (blue line). Moving averages act like gravity to prices on a chart; the further the extension from a moving average, the stronger the pull down. The last time such a big gap occurred was in May 2021, followed by a 5% correction. This means further upside is likely limited and downside risk is increased. Our indicators will signal profit-taking and position reduction probably in the next two weeks. We will inform our subscribers if that happens. This does not mean a crash will happen, but some kind of pullback is very likely. For subscribers, it is very important to follow our risk management measures that we provide with all our services to protect against losses in case the support zone breaks. Follow us for updates and guidance on navigating these market conditions.
The next few months
On the chart, you can see the seasonality for the S&P 500 in an election year, which anticipates weakness in May and then strongly rising prices until early September. This is followed by a bigger correction until the election in early November. From mid-June to the end of July, seasonality suggests some weakness and only moderate rising prices. This fits very well with our current analysis of overextension to the upside and the probability of some pullback. Of course, the seasonality data should be taken cautiously, especially this year because we have already had a significant rise in prices. Investors should consider both seasonality trends and our analysis for a balanced view. Proper risk management is essential in navigating these market conditions.

The macroeconomic environment is showing negative signs, with our Risk Level Indicator (RLI) increasingly confirming this outlook through various signals. The risk of a credit event remains elevated, adding to the prevailing economic concerns. Of particular note is the Federal Reserve’s Bank Term Funding Program (BTFP), which was initiated in response to last year’s banking crisis to aid banks struggling with high interest rates. However, this program has now expired, and banks are required to gradually repay the loans to the Fed over the course of a year. The RLI will promptly identify emerging issues and adjust the risk level accordingly, providing valuable insights for investors. Currently, a somewhat defensive allocation in stocks is advisable, given the uncertain economic climate.
The world of finance is complex and includes many technical terms. For explanations of these terms, I recommend using the Investopedia dictionary.
Leave a Reply