Tag: #StocksToBuy
-
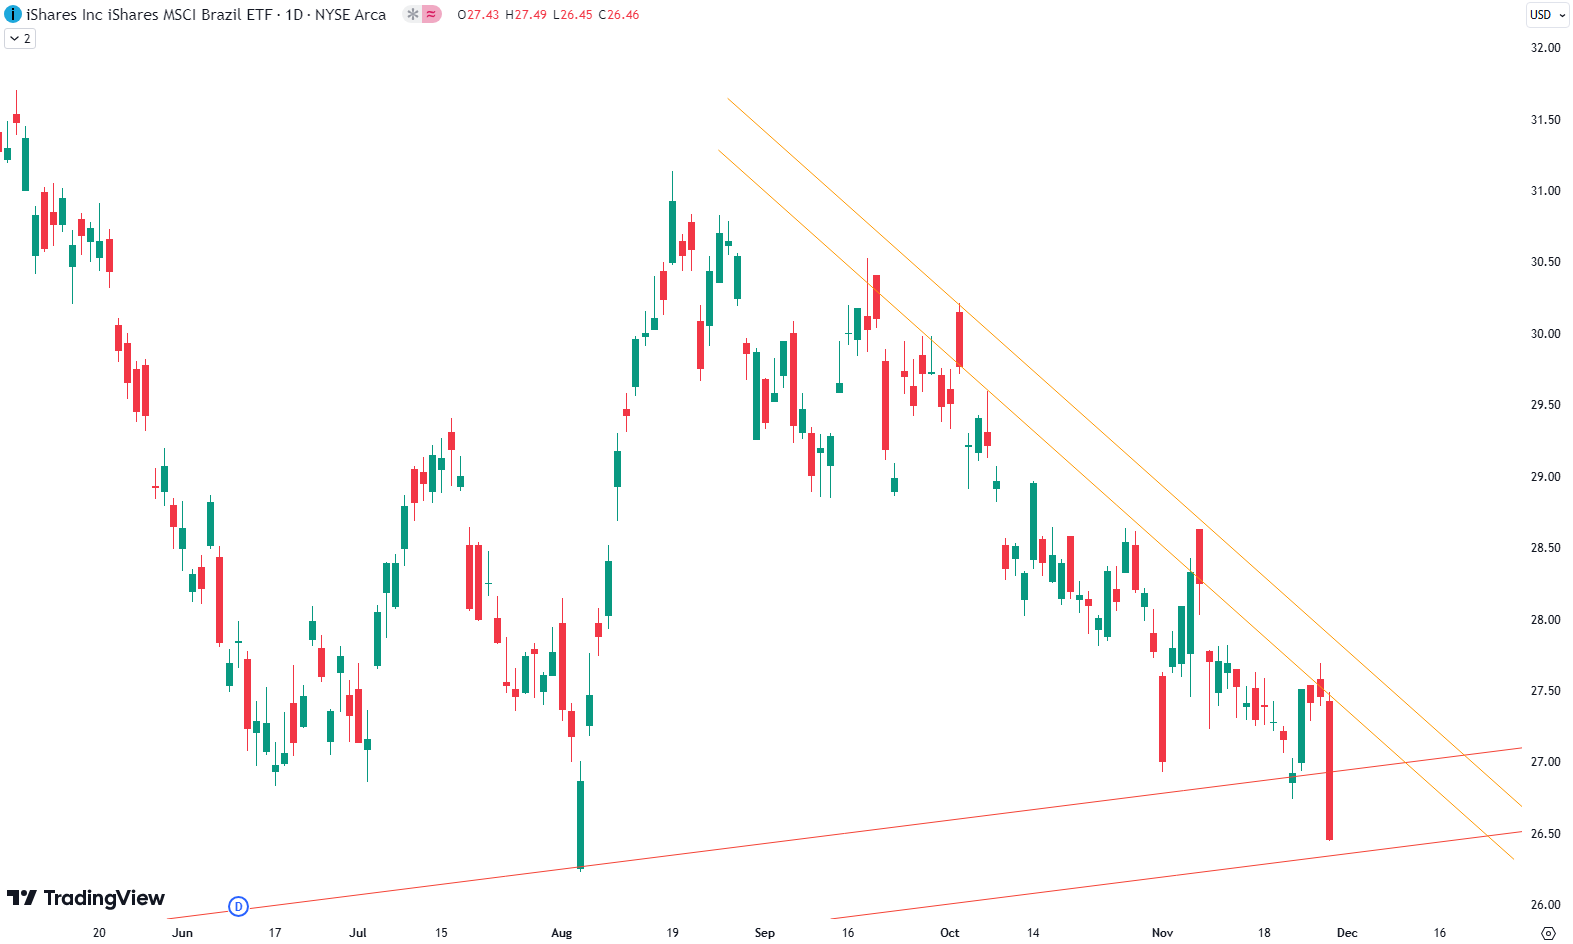
EWZ ETF: Brazil’s Stock Market at a Crossroads
This week, we’re diving into EWZ, the Brazilian ETF representing Brazil’s broader stock market. By analyzing its weekly and daily charts, we’ll uncover some intriguing patterns that may indicate a potential bounce. If you’re exploring global markets or ETFs, this is worth a closer look. Weekly Chart Analysis: A History of Support and Rebounds Looking…
-

Bitcoin Rally: What Long-Term Trend Lines Reveal About the Next Move
Bitcoin has been on a tear recently, gaining an impressive 45% since the beginning of November. For those new to cryptocurrency investing, this explosive move may seem sudden, but the charts tell a fascinating story of persistence, resistance, and eventual breakout. Tracking Bitcoin’s Journey: A Look at the Daily Chart The daily Bitcoin chart reveals…
-

Understanding Bonds Made Simple
What Are Bonds?Bonds are an essential but often overlooked investment option. At their core, bonds are loans that you, the investor, provide to a borrower—usually a corporation (corporate bonds) or a government (government bonds). In return, the borrower agrees to pay you interest for a set period, at the end of which you get your…
-
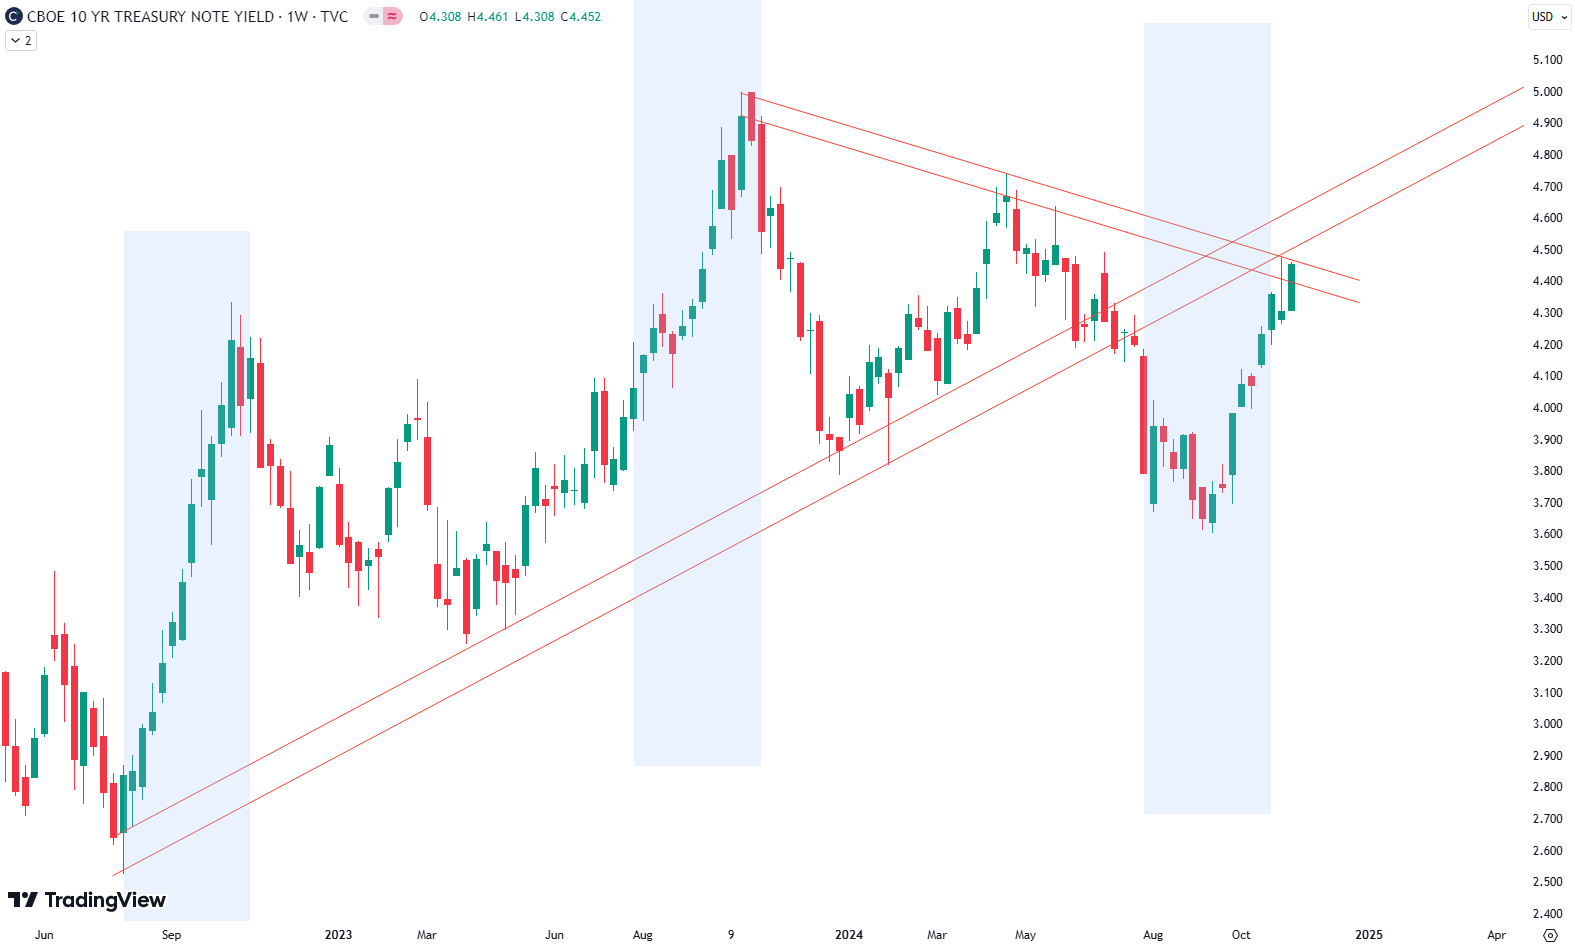
A Follow-Up on Bonds
Yield Watch: How Technical Indicators Are Shaping the 10-Year Treasury Yield This week, we’re taking a closer look at the technical indicators driving the US 10-year Treasury yield. Following last week’s article on the yield’s seasonal pattern, which typically peaks from August to October, we’re now focusing on key trendlines that are creating a strong…
-

Is it Bond-Buying Season?
Exploring the 10-Year U.S. Treasury Yield: Seasonal Patterns and Investment Insights The 10-year U.S. Treasury yield follows a notable seasonal pattern, typically rising in August, September, and October each year since 2016. During these months, the yield has usually increased by 22–40 basis points, although certain years, such as 2022 and 2023, saw surges of…
-

ASML’s Stock Price Drop: Opportunity or Risk?
ASML, a European tech giant, plays a pivotal role in the chip-making industry by producing machines essential to high-end chip manufacturing worldwide. This company’s influence on tech cannot be overstated. ASML’s stock, which has seen long-term growth, is a popular focus for investors, especially as recent market trends bring it near a potential buying opportunity.…
-
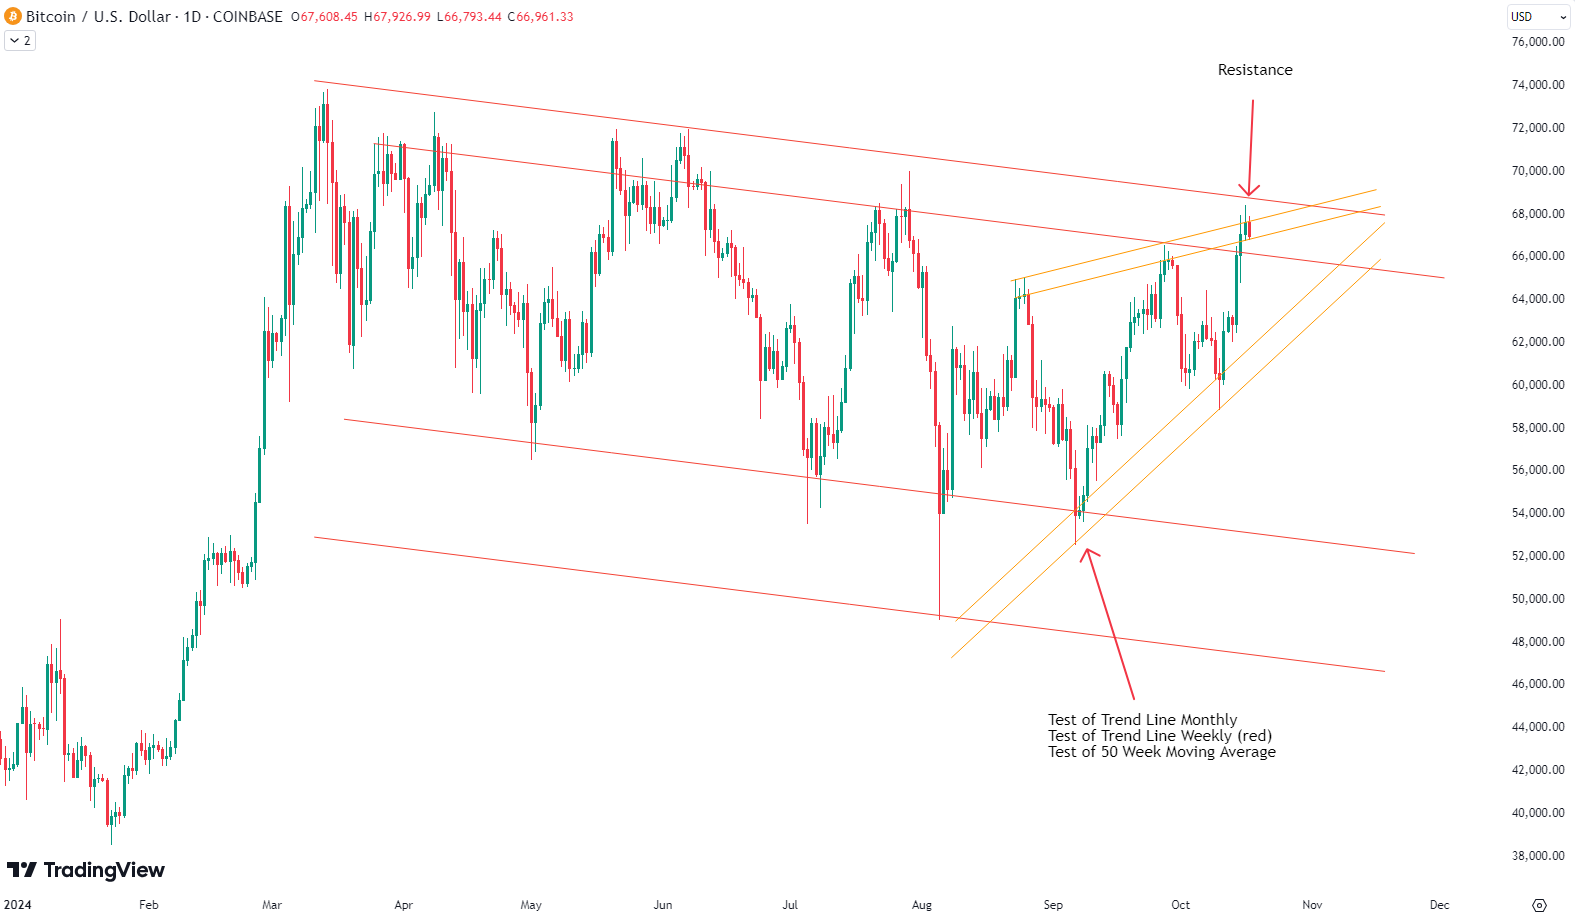
Bitcoin Approaching Critical Levels
Bitcoin has had an exciting journey this year. After a strong run-up in February and March, prices reached impressive levels before settling into a consolidation range. For those unfamiliar, this means that Bitcoin has been bouncing between two key levels: $70,000 at the top (resistance) and $56,000 to $58,000 at the bottom (support), without any…
-
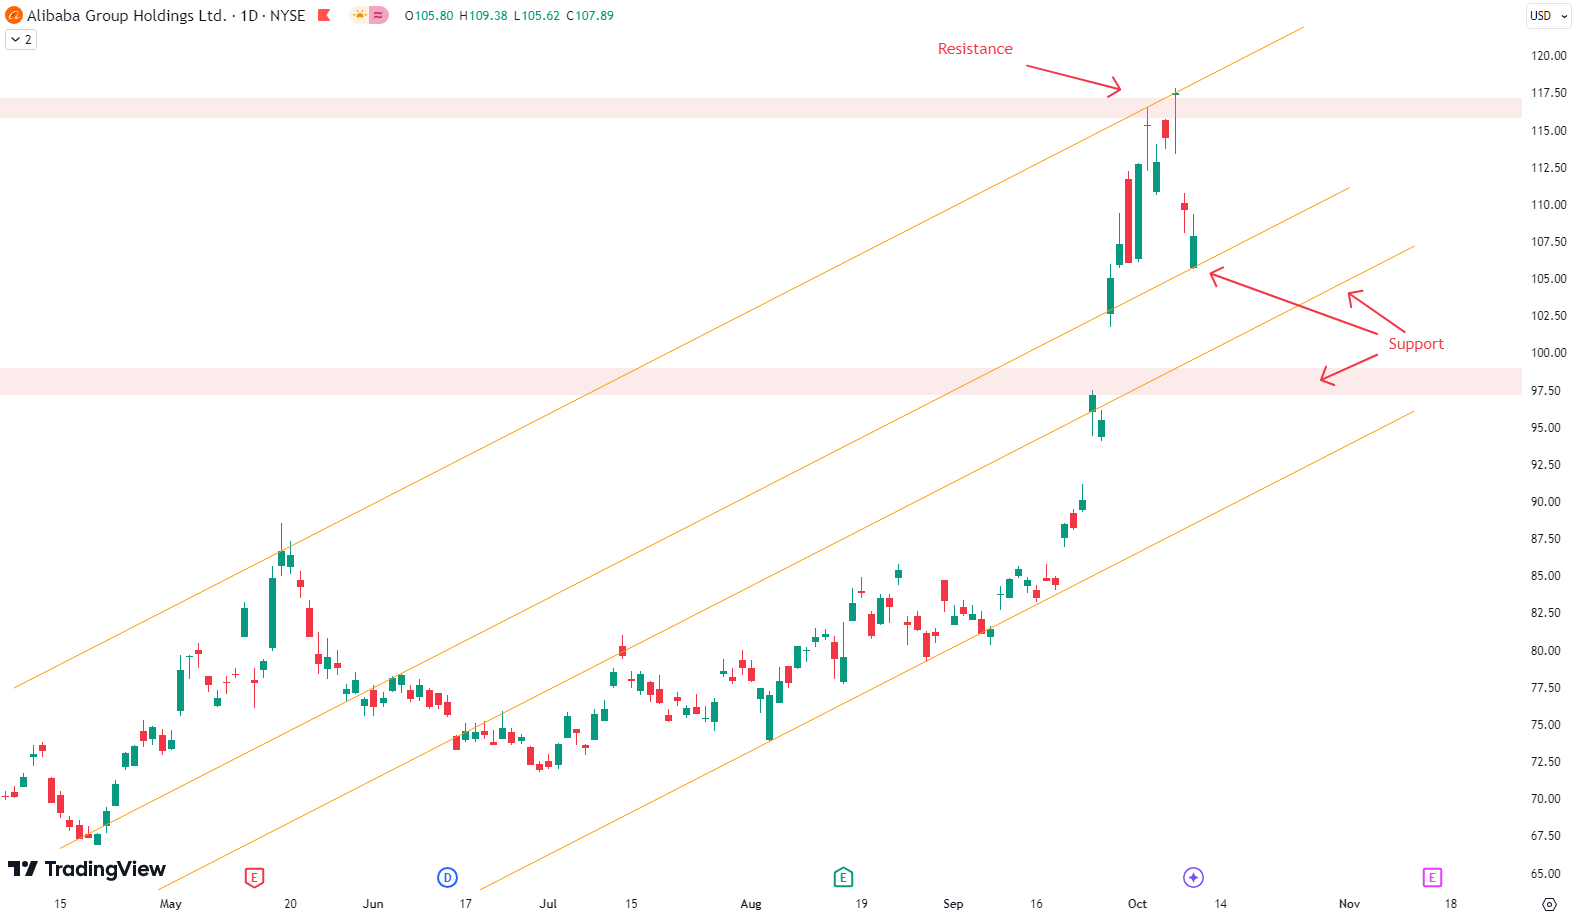
Understanding Alibaba’s Stock Movement – Is a New Buying Opportunity on the Horizon?
Alibaba, the Chinese e-commerce giant, has been making some interesting moves on the stock market lately, and if you’re a beginner investor, this might be a stock to keep an eye on. Let’s break down what’s been happening with Alibaba’s stock since May 2024 and why now could be a great time to consider an…
-

Understanding Position Sizing and Trade Management
Introduction to Position Sizing In this article, we’ll dive into the basics of position sizing within a portfolio and how it relates to trade management. Position sizing isn’t about thinking in terms of dollar amounts but in percentages of your portfolio’s overall value. This approach helps you manage risk and ensure your trades are proportional…
-
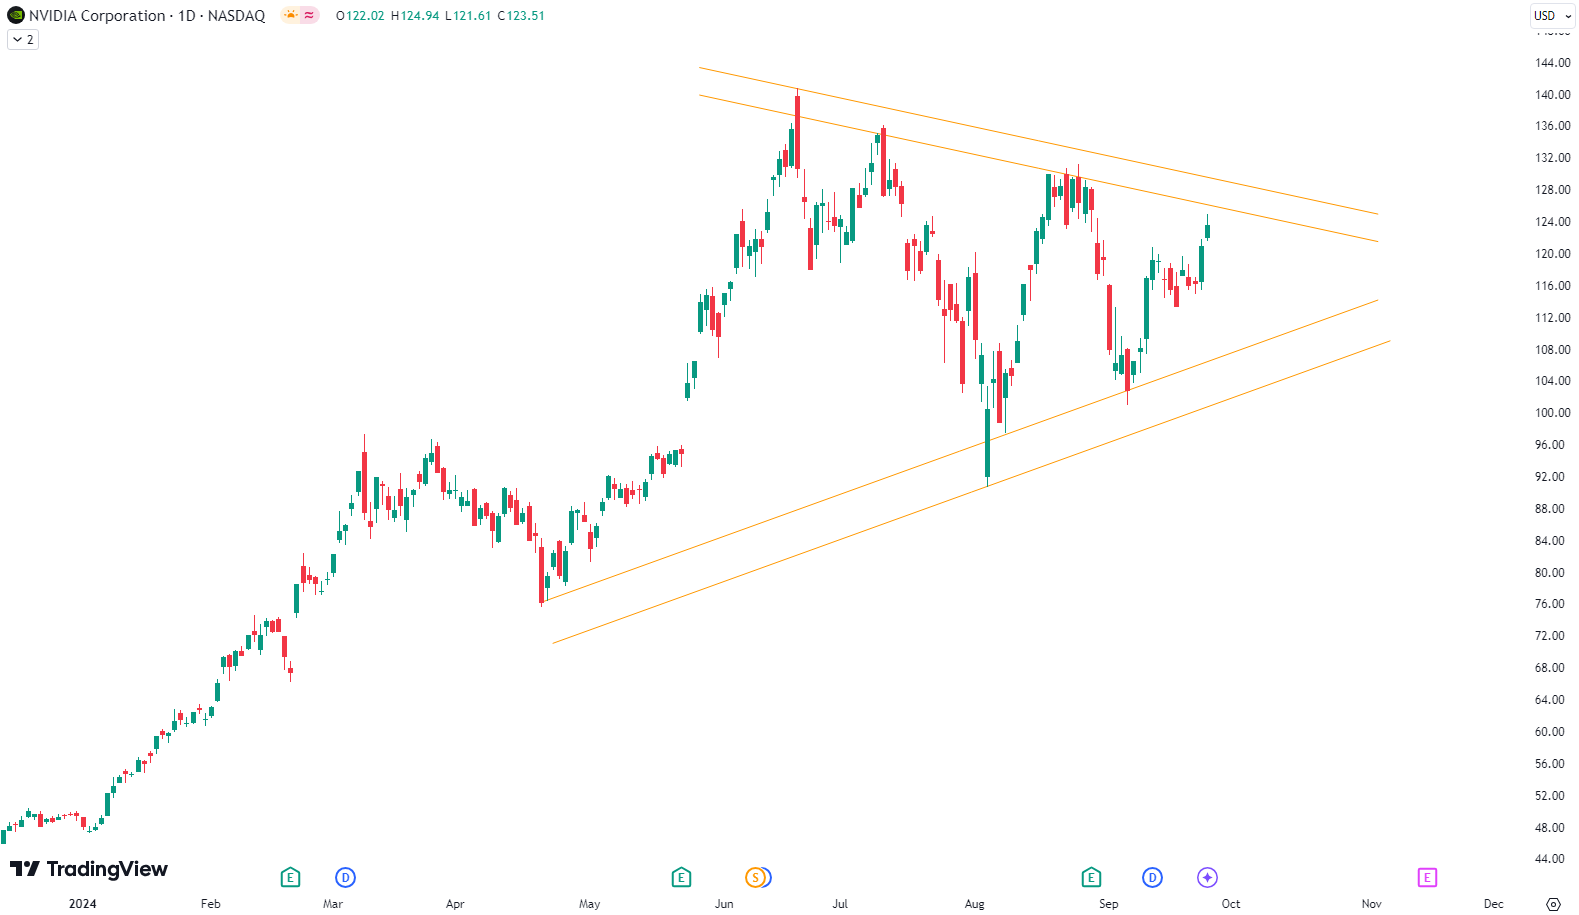
Nvidia forms Wedge
This week, we’re diving back into Nvidia. A few weeks ago, we discussed the company and focused on its price movements around a key logarithmic trend line. Since mid-June, Nvidia has seen wild swings, with 20-30% fluctuations in both directions. Are you wondering when to buy Nvidia as an investor? Explore our tailored services and…