Tag: #StockMarket
-
Weekly Update S&P 500
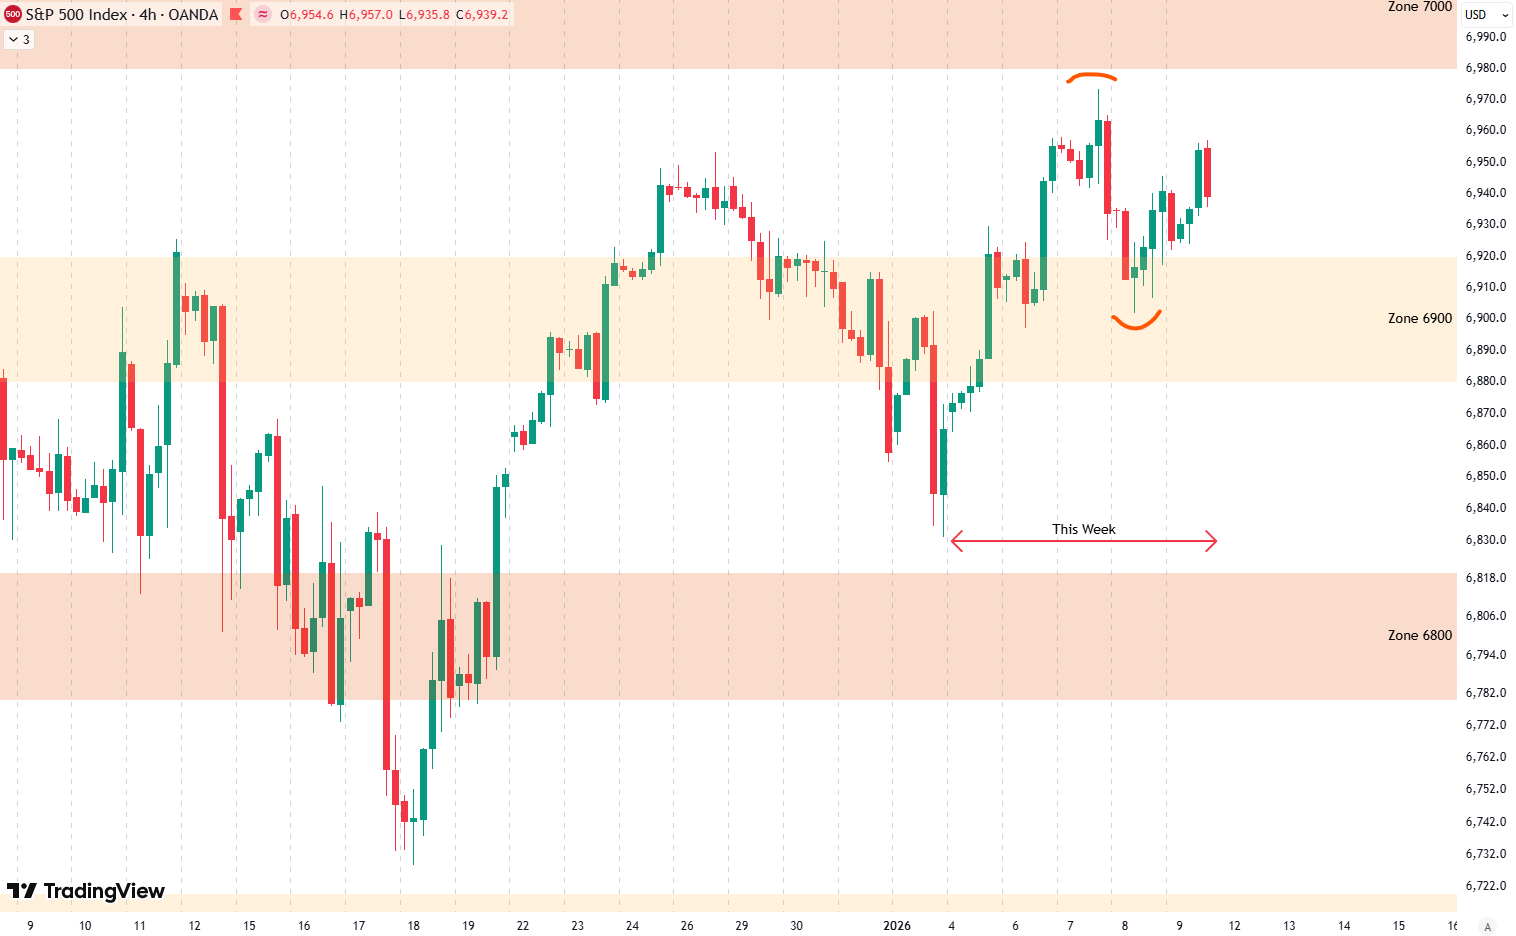
Hello everybody, and welcome to this week’s analysis of the S&P 500. I’m writing this right around the New York market open on Friday, so the final trading day of the week is not fully included yet. So far, it has been a solid week, with the index up about 1.1%. Looking at the 4-hour…
-
Weekly Update S&P 500
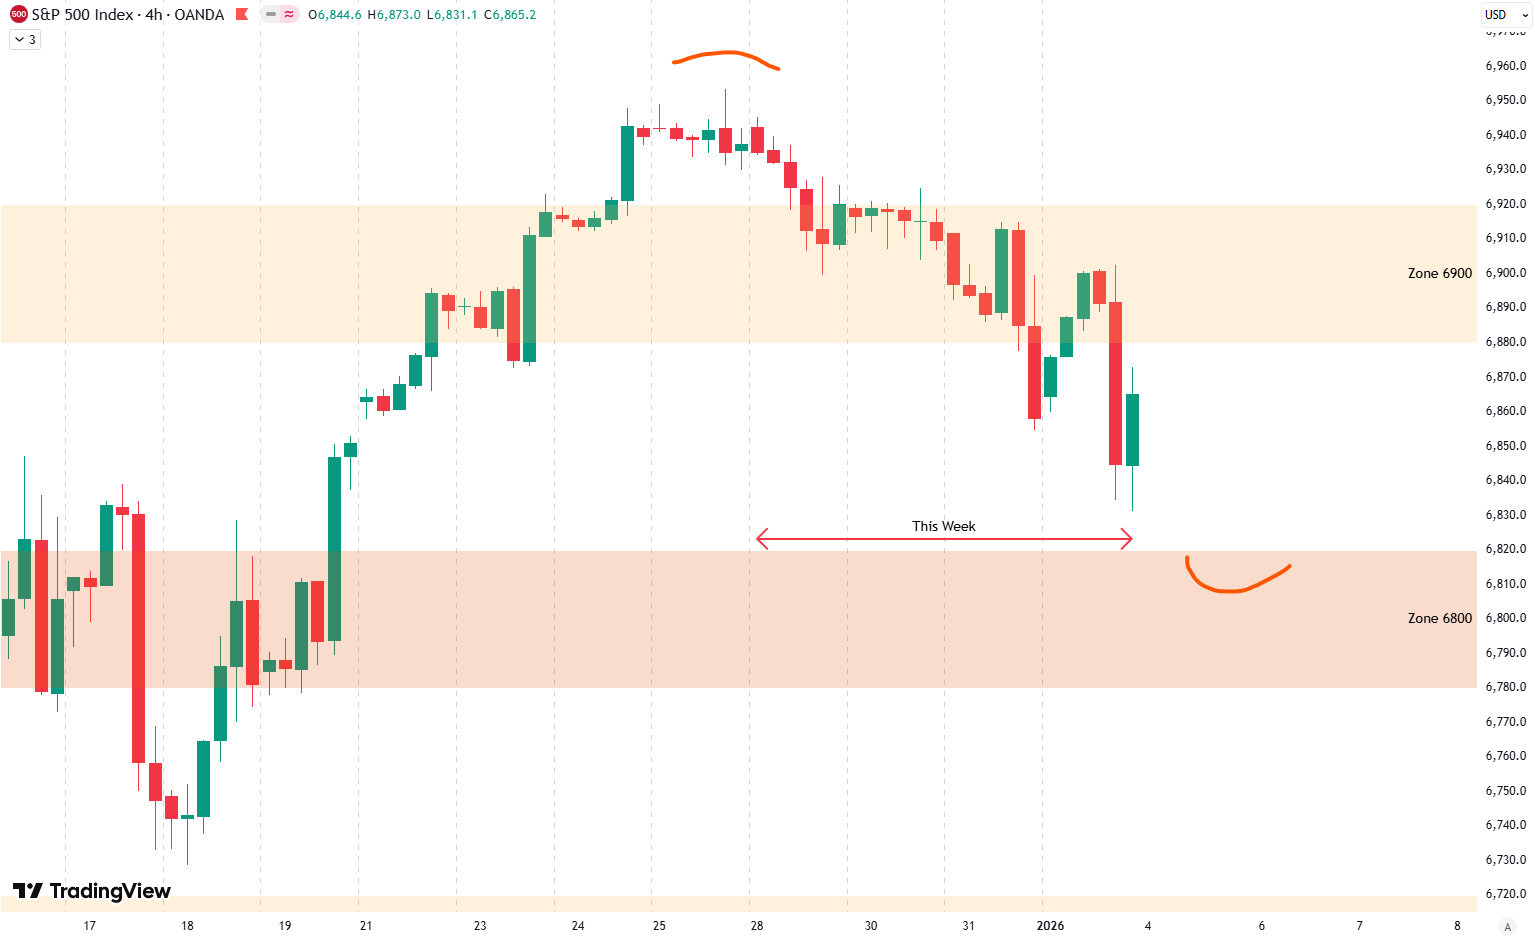
Hello everybody, and welcome to this week’s analysis of the S&P 500. We had a somewhat weak week, with the index down about 1%. Looking at the 4-hour chart, we can see this week’s price action clearly. After reaching a new all-time high last Friday, just after Christmas, the market started to decline from Monday…
-
Weekly Update S&P 500
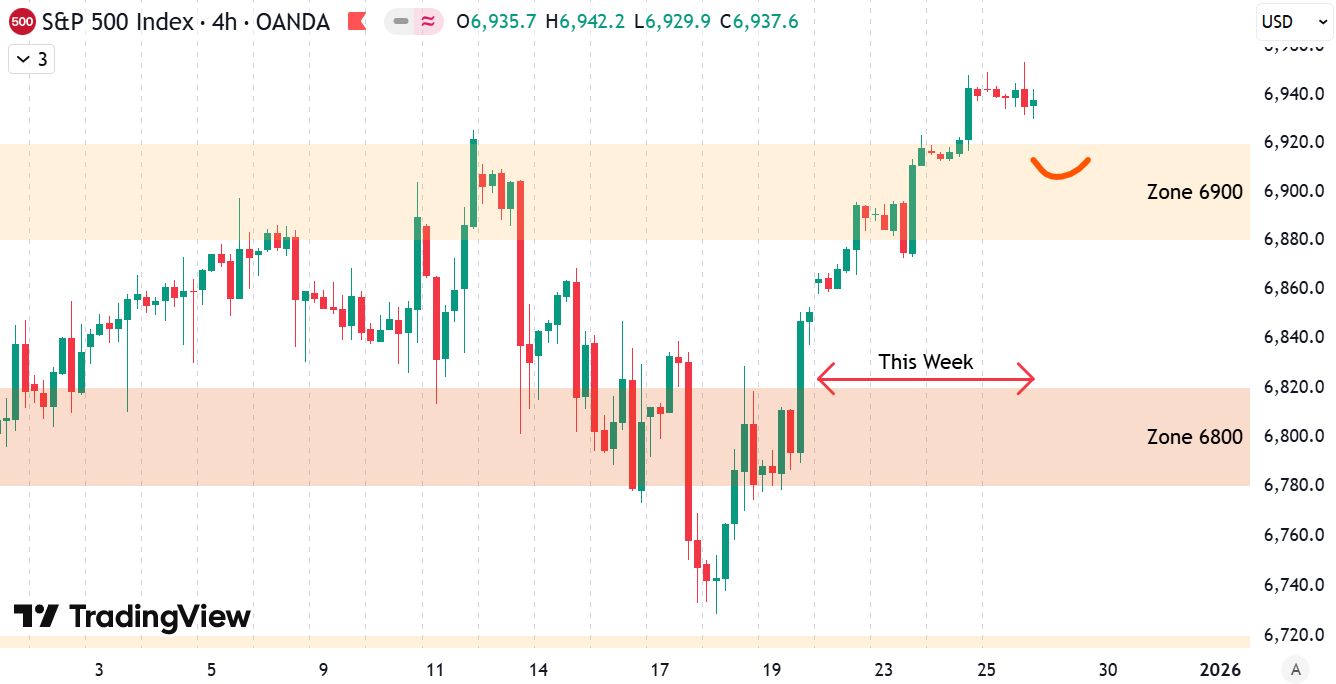
Welcome to this week’s analysis of the S&P 500. We had a very solid trading week, slightly shortened due to the Christmas holidays. I hope you all had a great Christmas with your families. The S&P 500 also had a strong holiday week, gaining about 1.3%. Looking at the 4-hour chart, we can see a…
-

Weekly Update S&P 500
Welcome to our weekly newsletter on the S&P 500. I’m writing this before the New York market open on Friday, so the final trading day of the week is not yet included. So far, the S&P 500 is down about 0.3% for the week. Looking at the 4-hour chart, we can see that we already…
-

Weekly Update S&P 500
Hello everybody, and welcome to this week’s analysis on the S&P 500. I’m writing this shortly after the New York market open on Friday, so not all trading hours for the week are included yet. Still, this week has been quite interesting. On the 4-hour chart, you can see that last Friday we had the…
-
Weekly Update S&P 500
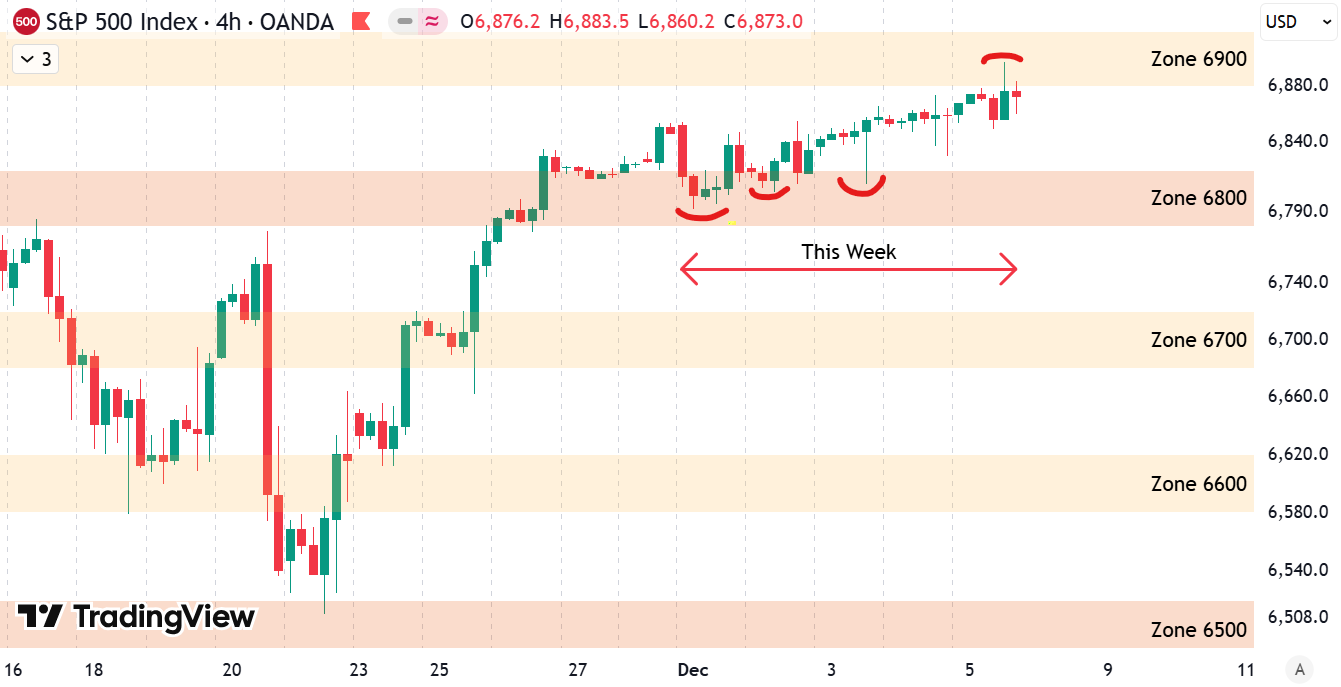
Welcome to this week’s update on the S&P 500. Not much happened overall, and the index finished the week with a slight gain of 0.4%.Looking at the 4-hour chart, we discussed last week that a retest of the 6800-point zone was likely. As you can see, we had several tests of that area throughout the…
-

Weekly Update S&P 500
Hello everybody, and welcome to this week’s analysis on the S&P 500. The index had a very strong week, up around 3.5%. Looking at the 4-hour chart, we can see that last Friday the S&P 500 formed its bottom after the sharp drop on Thursday. The low from Friday, which I marked in red around…
-
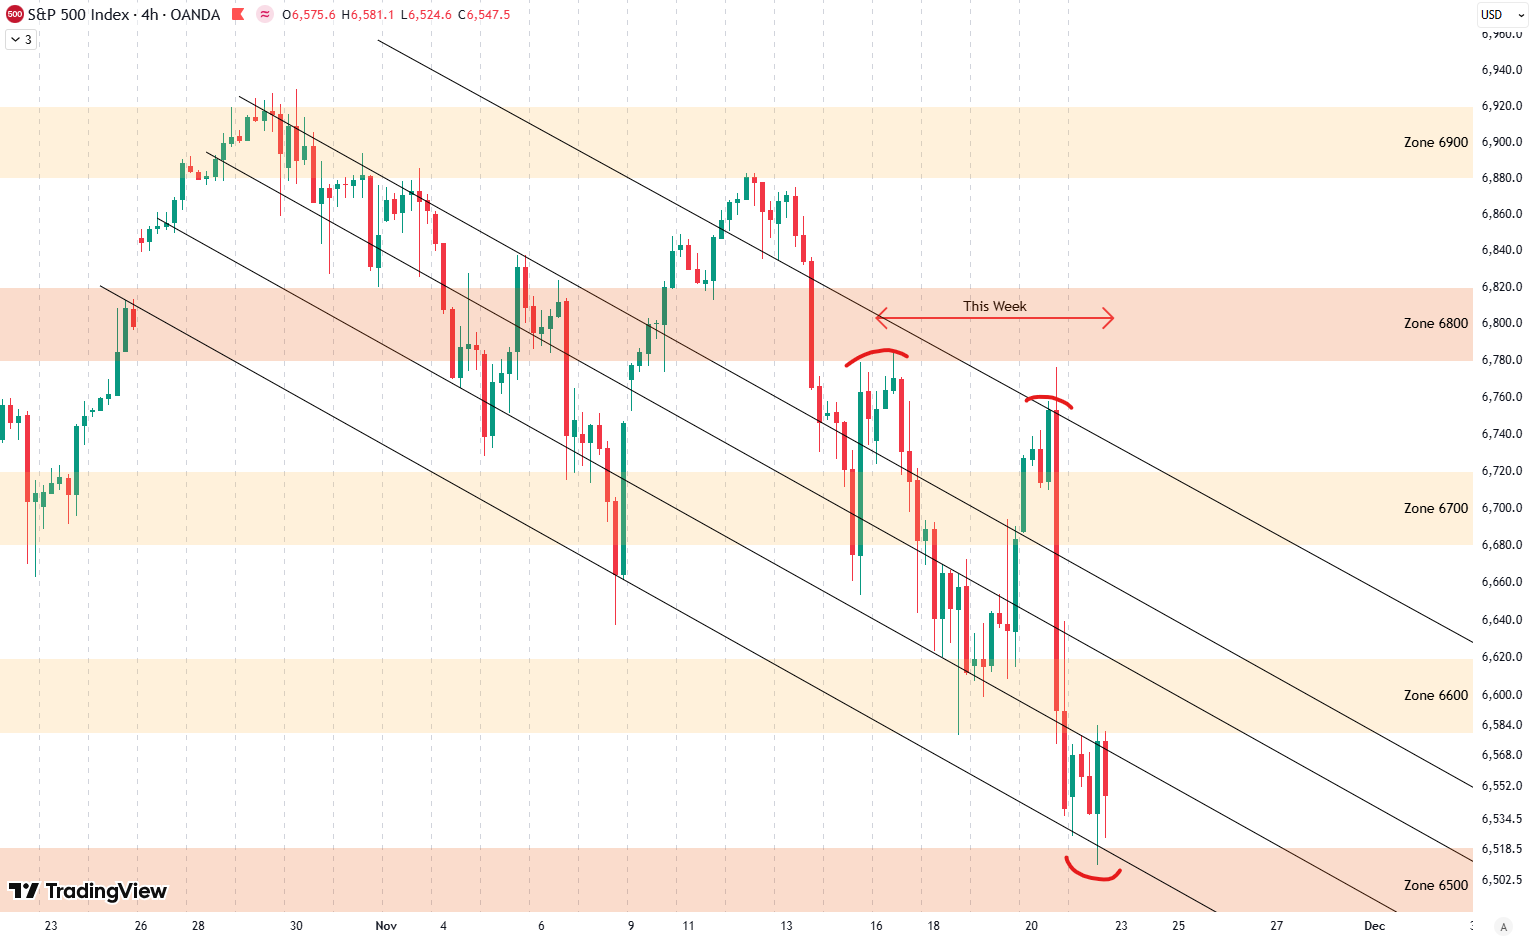
Weekly Update S&P 500
Hello everybody, and welcome to our weekly analysis on the S&P 500. I’m writing this shortly after the U.S. market open on Friday, so the full trading week isn’t finished yet. So far, it has been a weak week, with the S&P 500 down about 3.2%.Looking at the 4-hour chart, you can see the black…
-
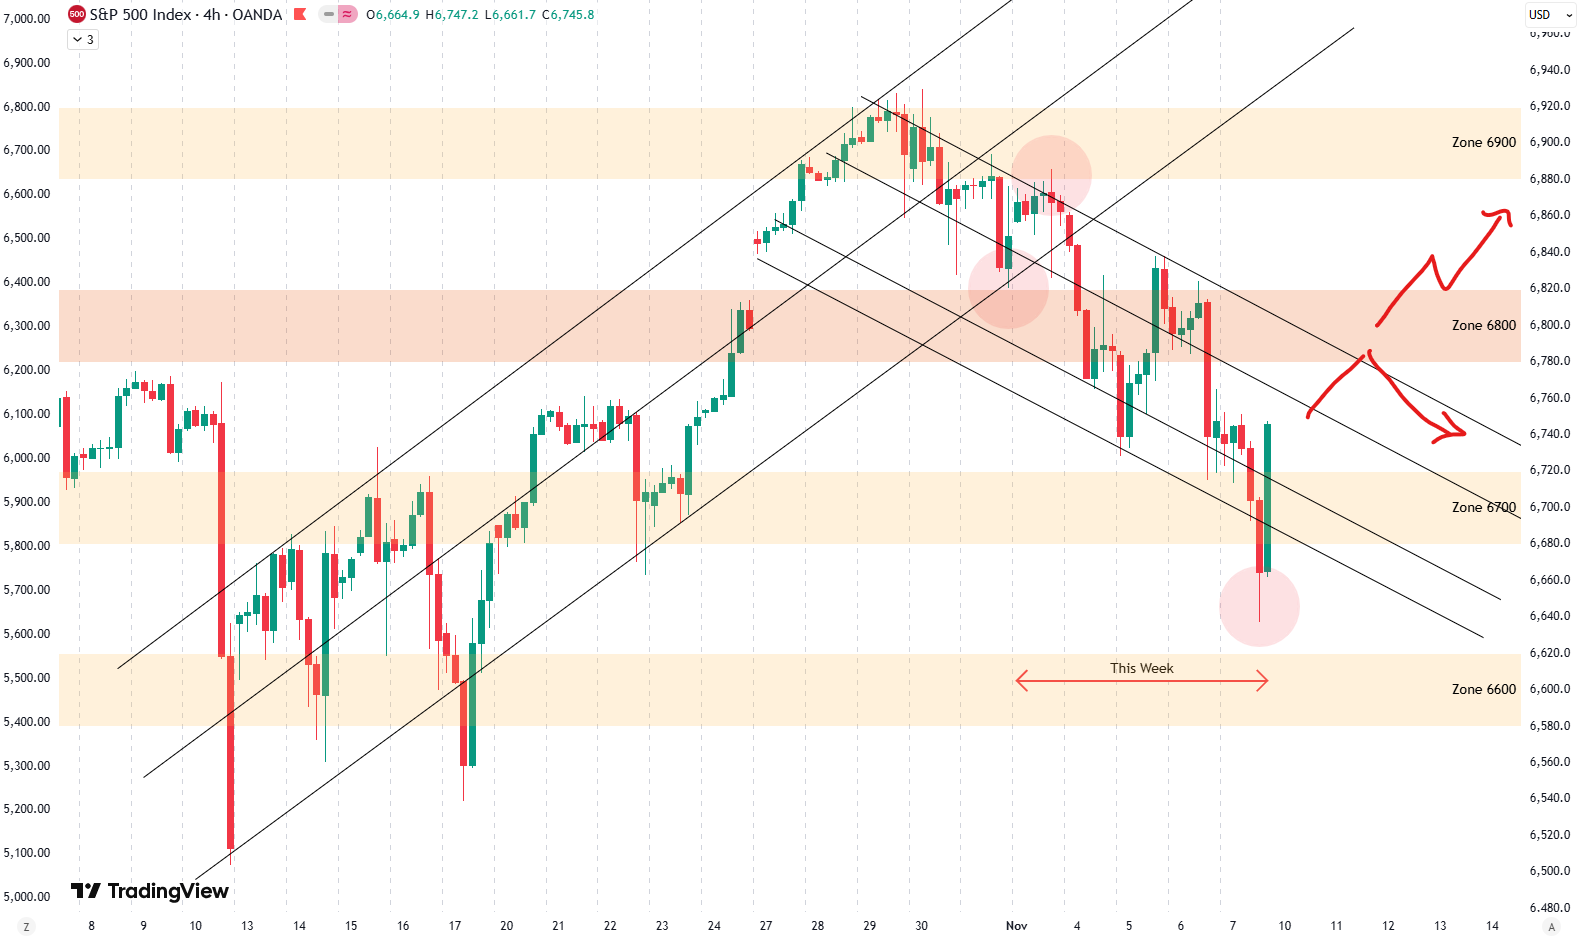
Weekly Update S&P 500
Hello everybody, and welcome to this week’s analysis on the S&P 500. It was quite a volatile week. After the very strong bounce last Friday, the S&P 500 continued that strength into the start of this week. On the 4-hour chart, we can see how the index was able to break out of the declining…
-
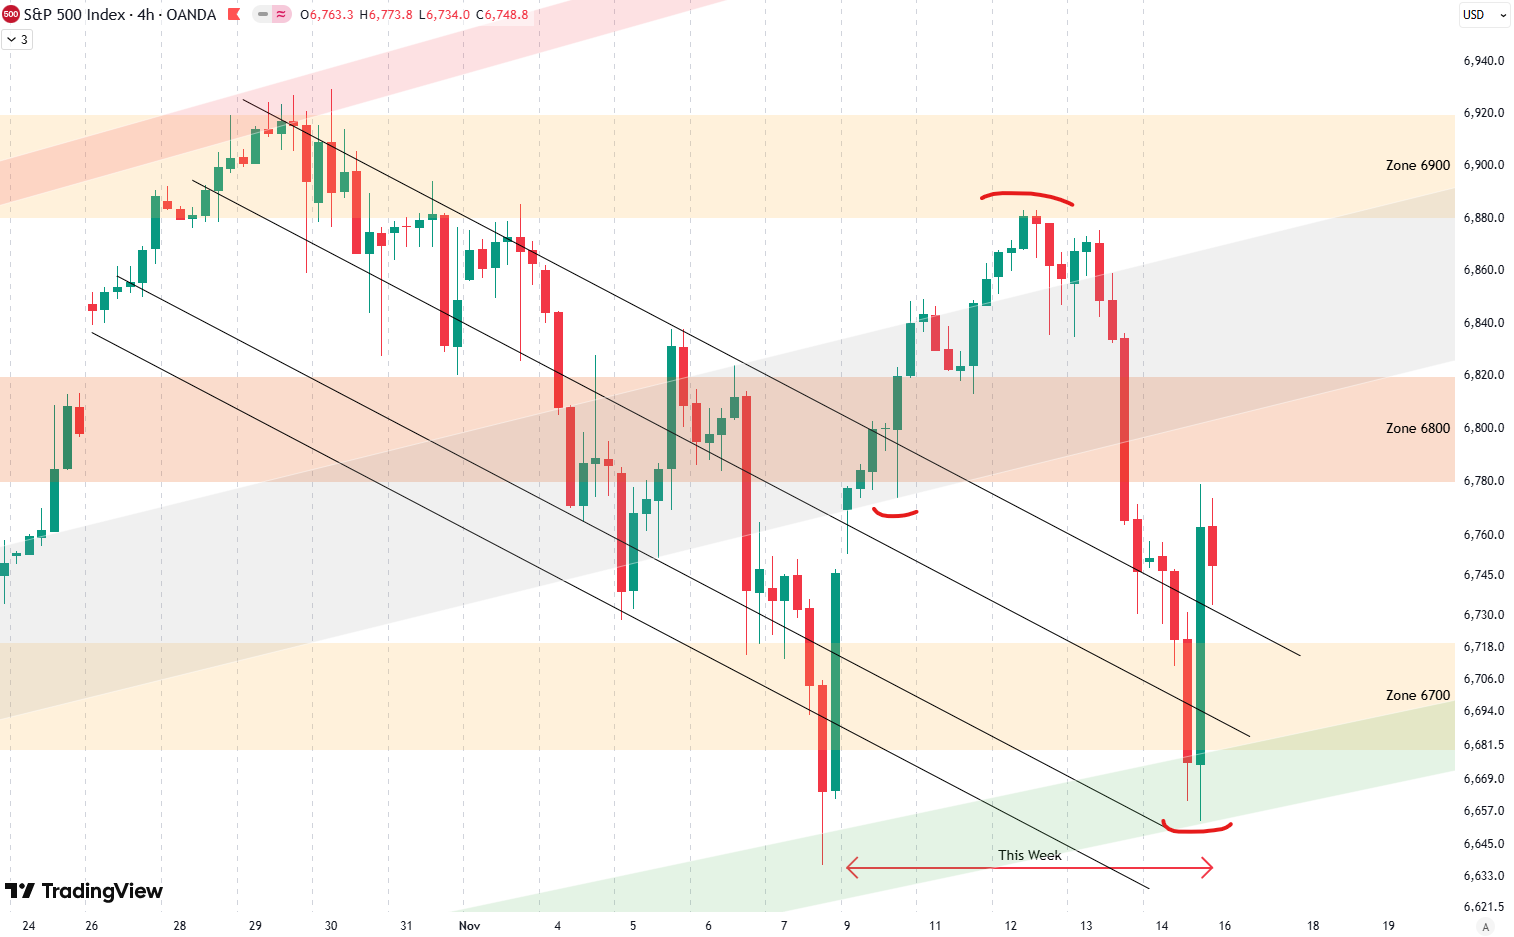
Weekly Update S&P 500
Welcome to this week’s analysis of the S&P 500. It was another very interesting week, with the index closing down 1.5%. Looking at the 4-hour chart, last week we discussed the short-term upward-rising trend channel, which is shown here with the black trend lines. On Friday, we saw a very clean test of the lower…