Tag: #SPY
-
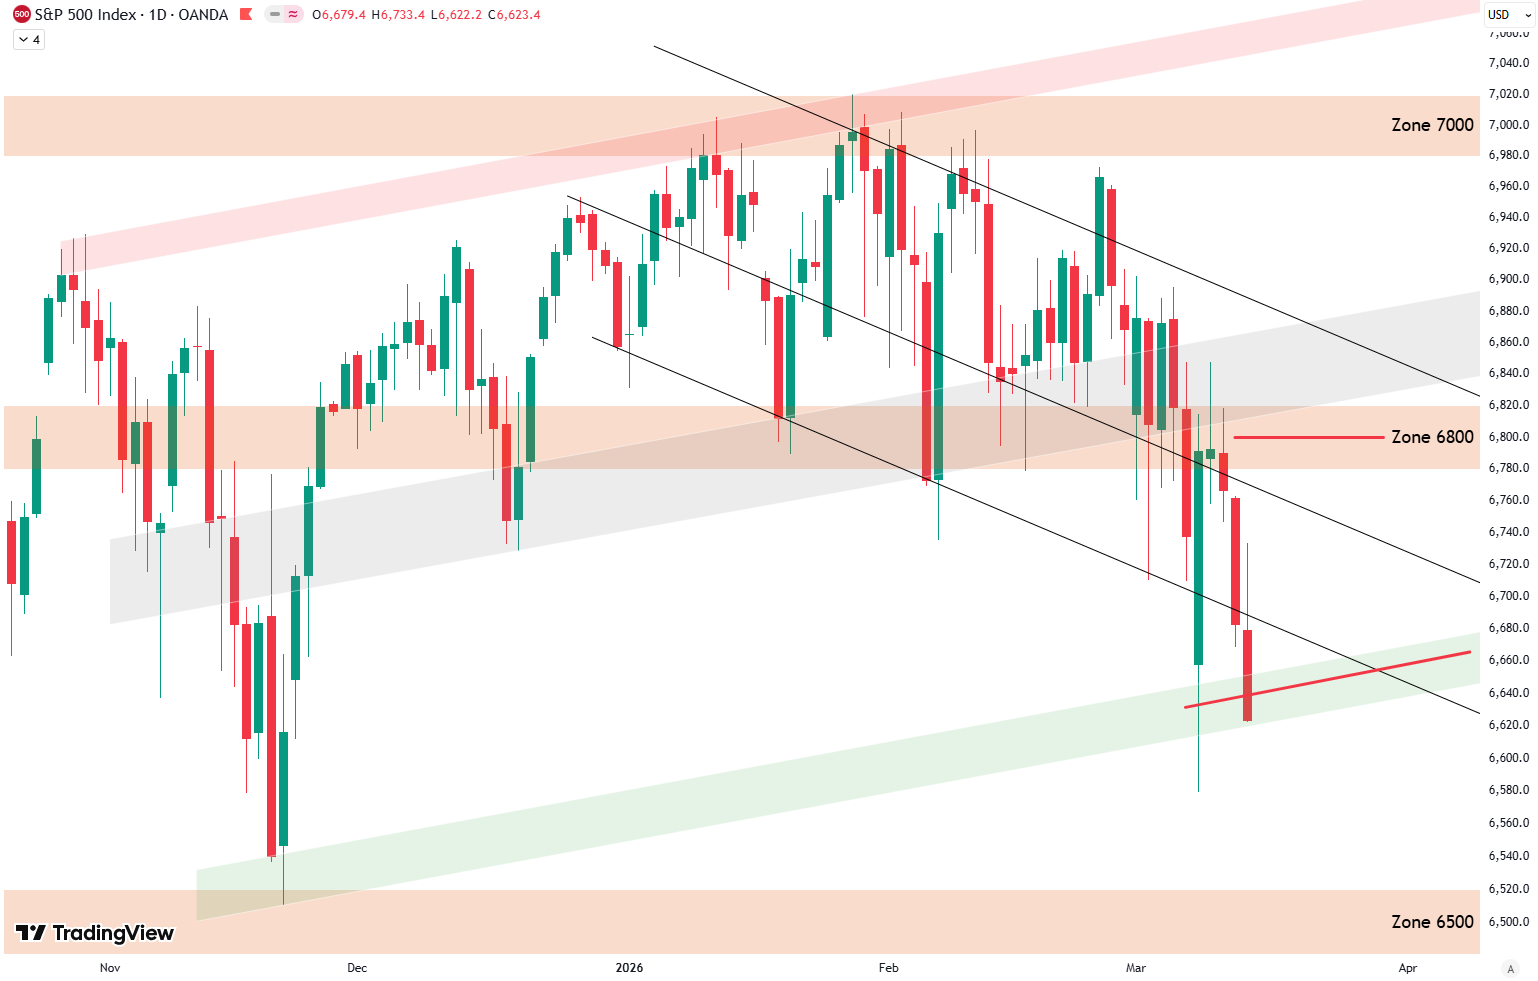
Weekly Update S&P 500
Week 11, 2026 | -1,7% Daily Technicals (Next Week)Levels marked in red on the chart.The green shaded trendline acts as the price floor. Short Term Risk (Next 12 Weeks) Bottom: Buy score in green, sell score in red, S&P 500 in black. Top right: Zoomed in version. Top left: Buy and sell signals as vertical…
-
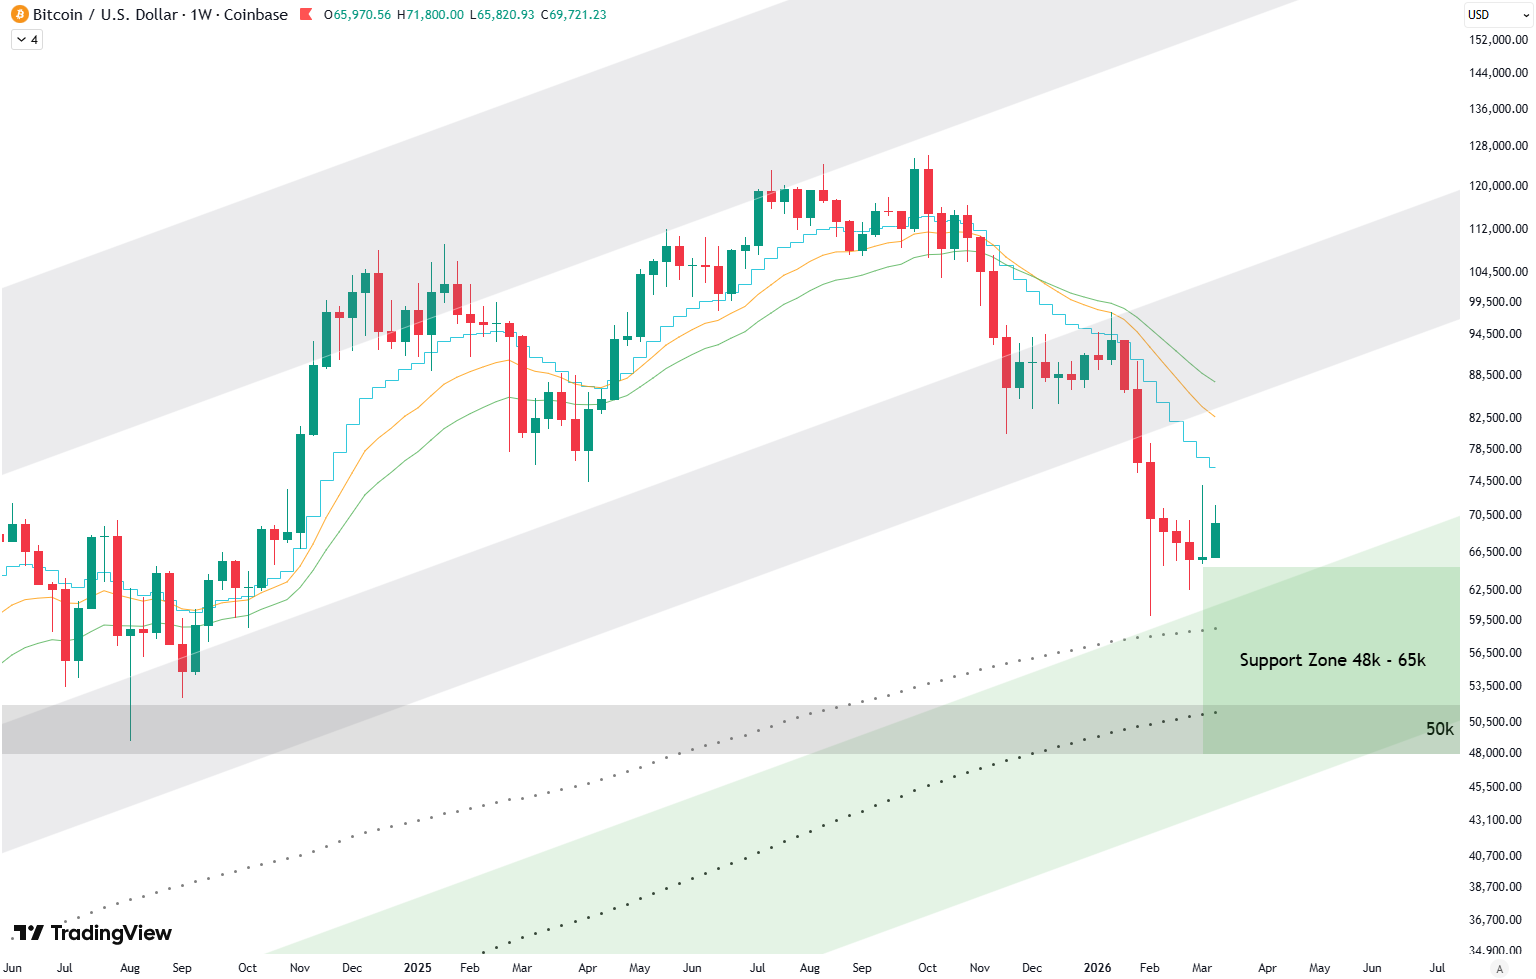
Bitcoin Update
March 12, 2026 | 43% below top | 22 weeks since high Support & Resistance Our StrategyBitcoin bottoms historically form over several months, not instantly. There for a possible approach would be: DashboardAll information summarized in our dashboard: Stay ahead of the market! Sign up for our weekly updates and get additional expert insights on…
-
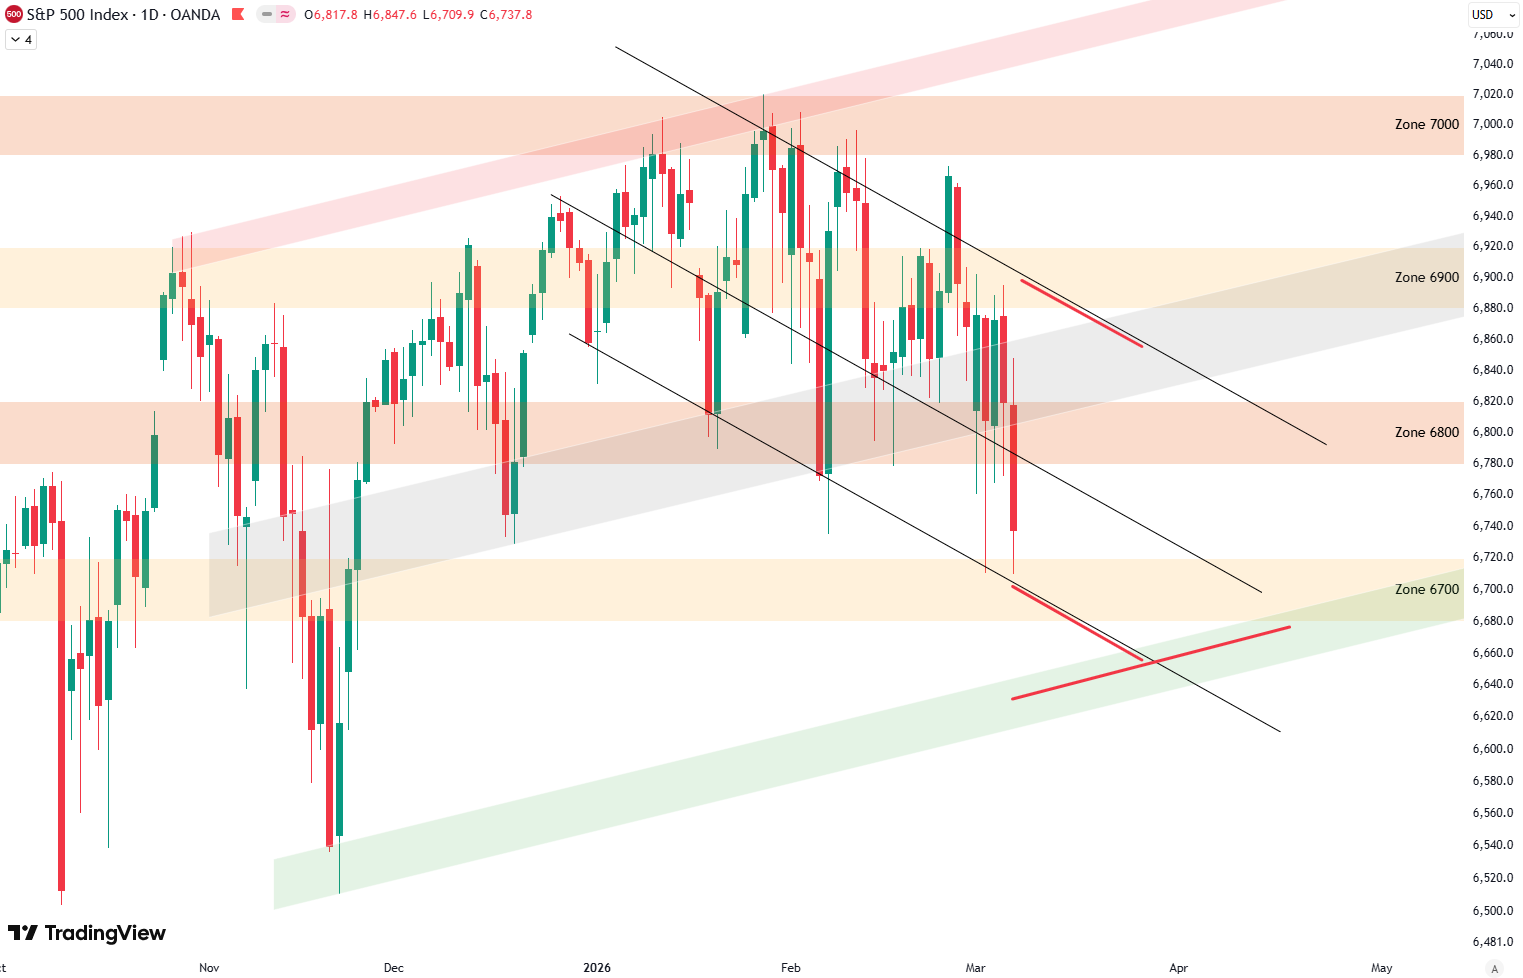
Weekly Update S&P 500
Week 10, 2026 | -1,9% Daily Technicals (Next Week)Bullish at lower black and green trendlineBearish at upper black trendlineNew levels this week, marked in red on the chart.The short-term trend channel (black trendline) continues to cap prices. Short Term Risk (Next 12 Weeks)No signal this weekA very low sell score and a declining buy score…
-
Weekly Update S&P 500
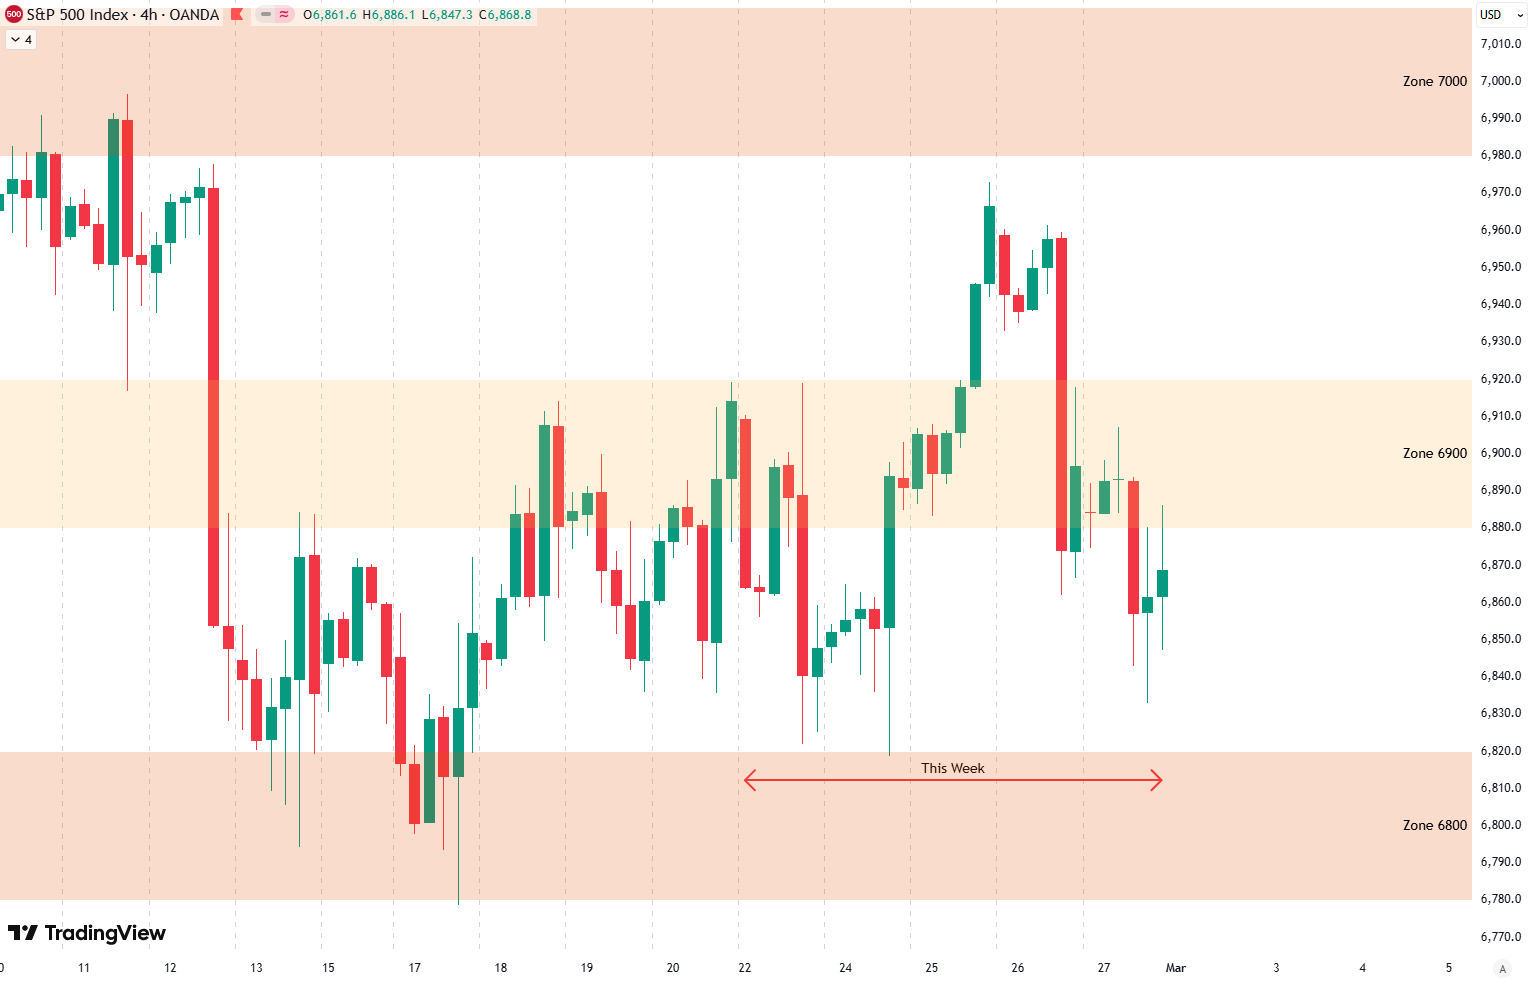
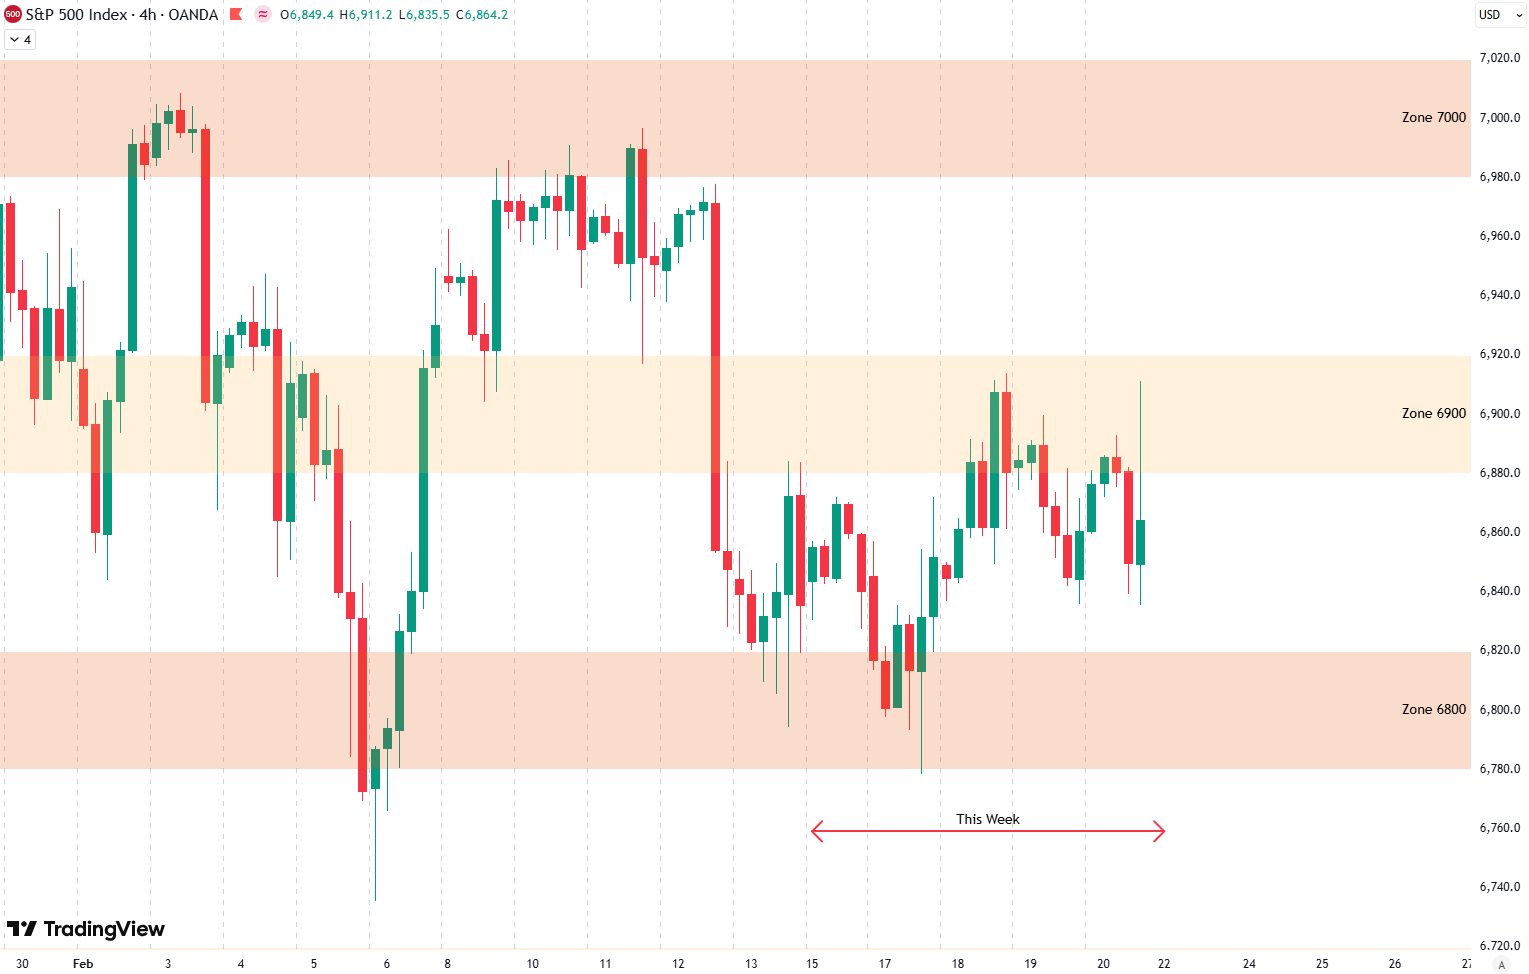
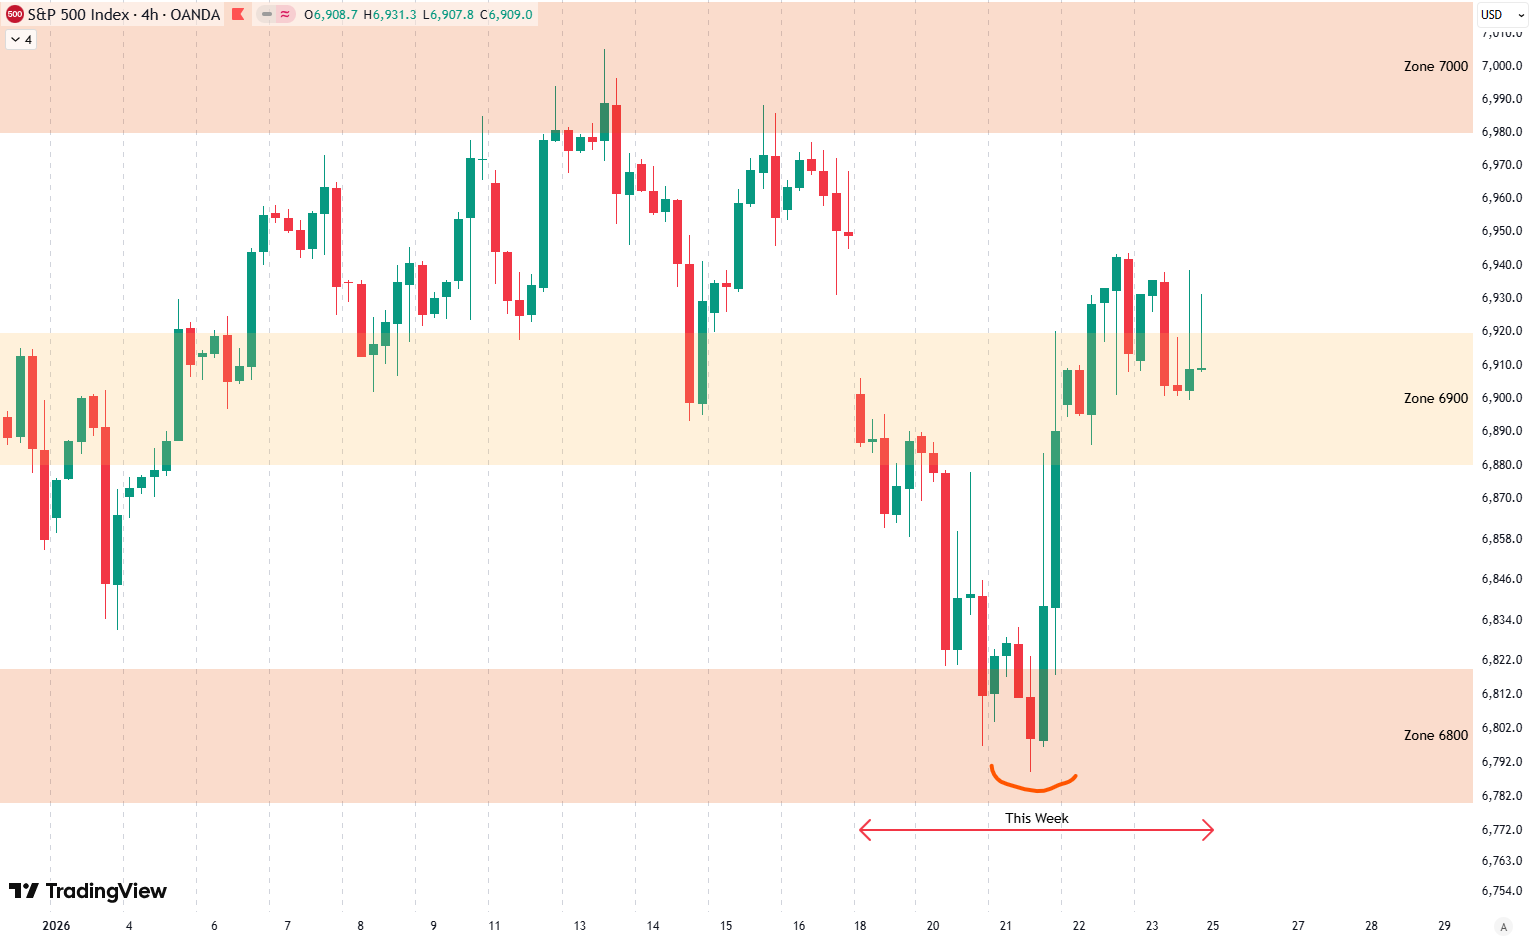
Hello everybody, and welcome to this week’s analysis of the S&P 500. The index lost 0.6% this week, so it finished slightly lower. Looking at the 4-hour chart, we can see that price first moved higher into the middle of the week and then declined again. Overall, we are still trading between the two key…
-
Weekly Update S&P 500
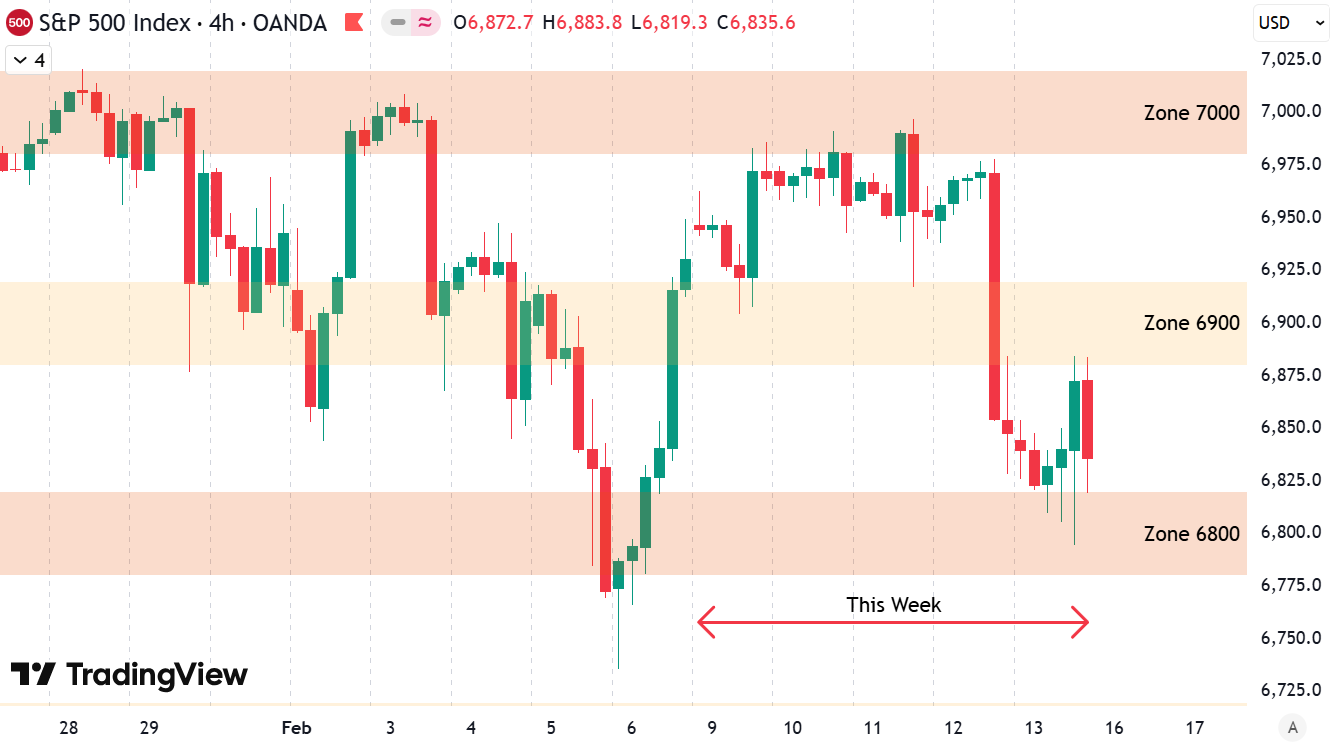
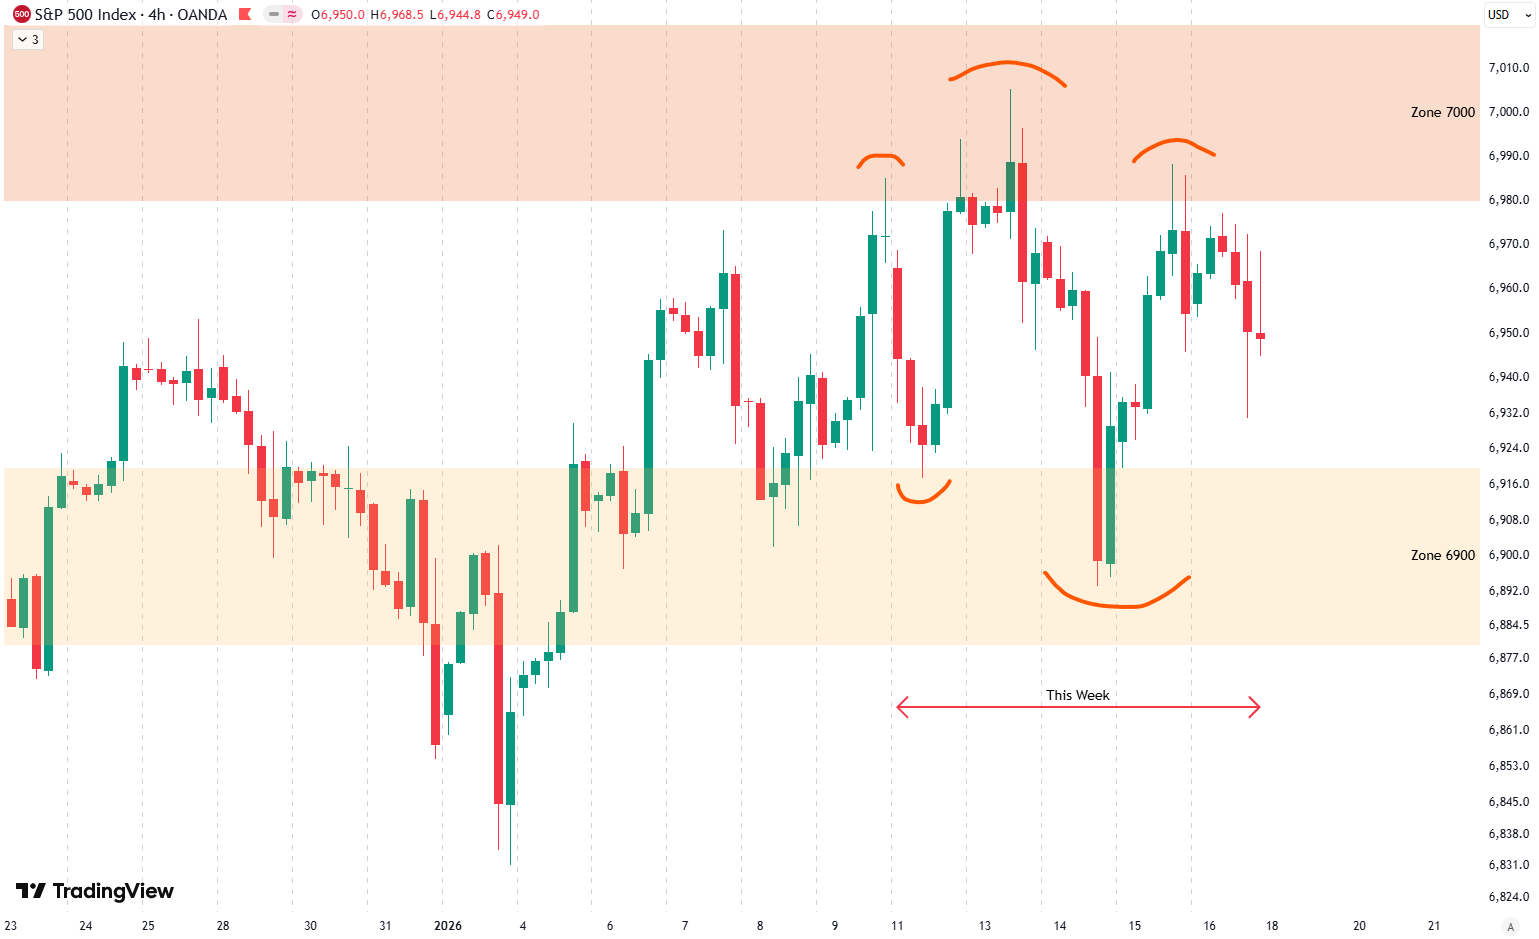
Hello everybody, and welcome to this week’s analysis of the S&P 500. I am writing this during Friday’s trading session, so the week is not yet fully completed. As of now, the S&P 500 is up about 0.5% for the week, although that can still change by the close. Looking at the 4-hour chart, we…
-
Weekly Update S&P 500
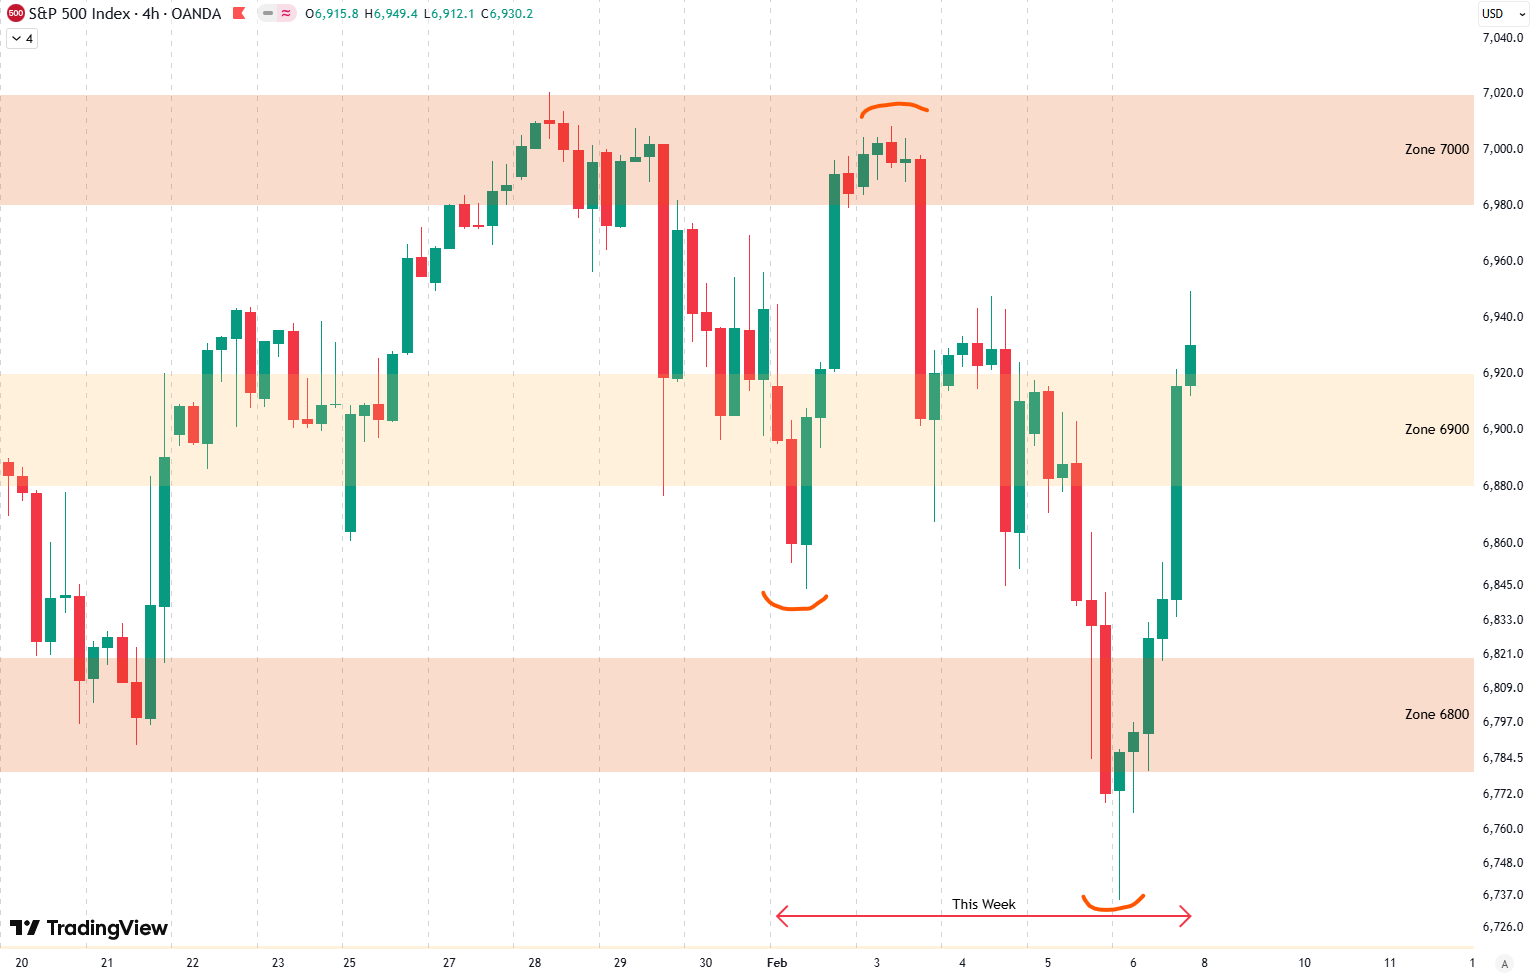
Hello everybody, welcome to this week’s analysis of the S&P 500. The S&P 500 lost 1.4% this week. We saw relatively stable consolidation below the 7,000-point zone during most of the week, followed by another test of the 7,000 resistance on Thursday. After that, the market dropped sharply and made a low on Friday, testing…
-
Weekly Update S&P 500
Hello everybody, and welcome to this week’s analysis of the S&P 500. We had another quite volatile week. Looking at the 4-hour chart, we can see that the index finished the week down about 0.2%, so overall it did not go anywhere. However, volatility was very high. On Monday, the market made a low and…
-
Weekly Update S&P 500
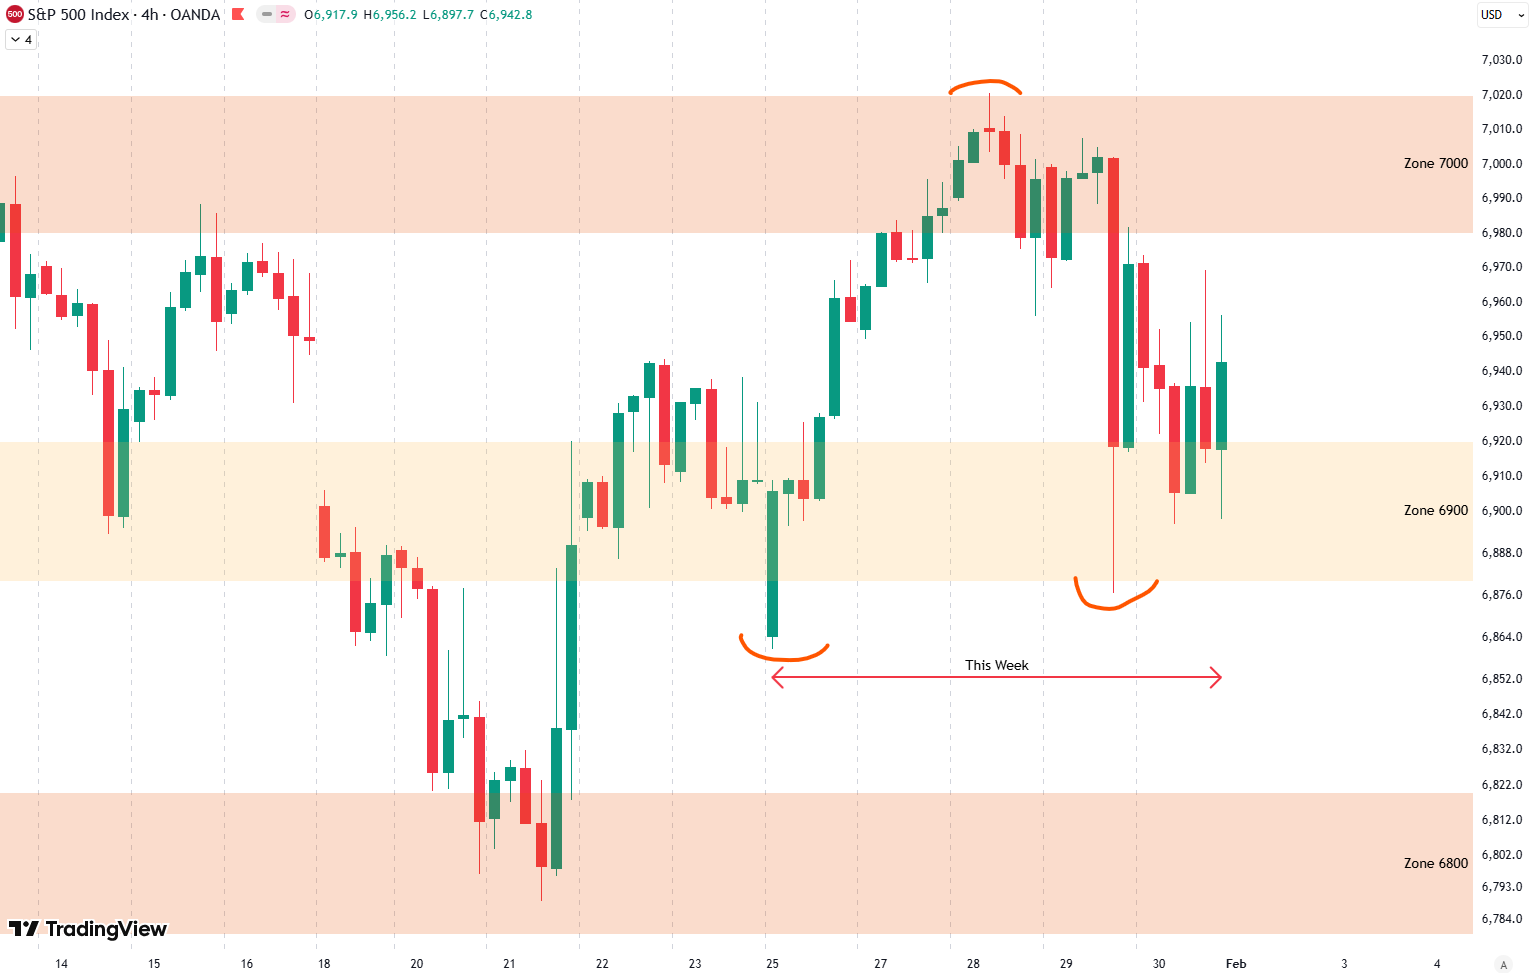
Hello everybody, and welcome to this week’s analysis of the S&P 500. The index finished the week with a gain of 0.5%. Looking at the 4-hour chart, we can see that the week started with a small drop, followed by a strong recovery on Monday and Tuesday. Price moved up from the 6,900-point support zone…
-
Weekly Update S&P 500
Hello everybody, and welcome to this week’s analysis of the S&P 500. We had another quite volatile week, with the index closing down about 0.6%. As you can see on the 4-hour chart, we experienced a strong gap down on Monday, followed by further downside pressure into midweek. The market made a low on Wednesday,…
-
Weekly Update S&P 500
Hello everybody, and welcome to this week’s analysis of the S&P 500. We had a very choppy week with a lot of ups and downs, and overall the index closed about 0.3% below last week’s close. Looking at the 4-hour chart, we can clearly see this back-and-forth price action throughout the entire week. Monday was…