Tag: #SPX
-
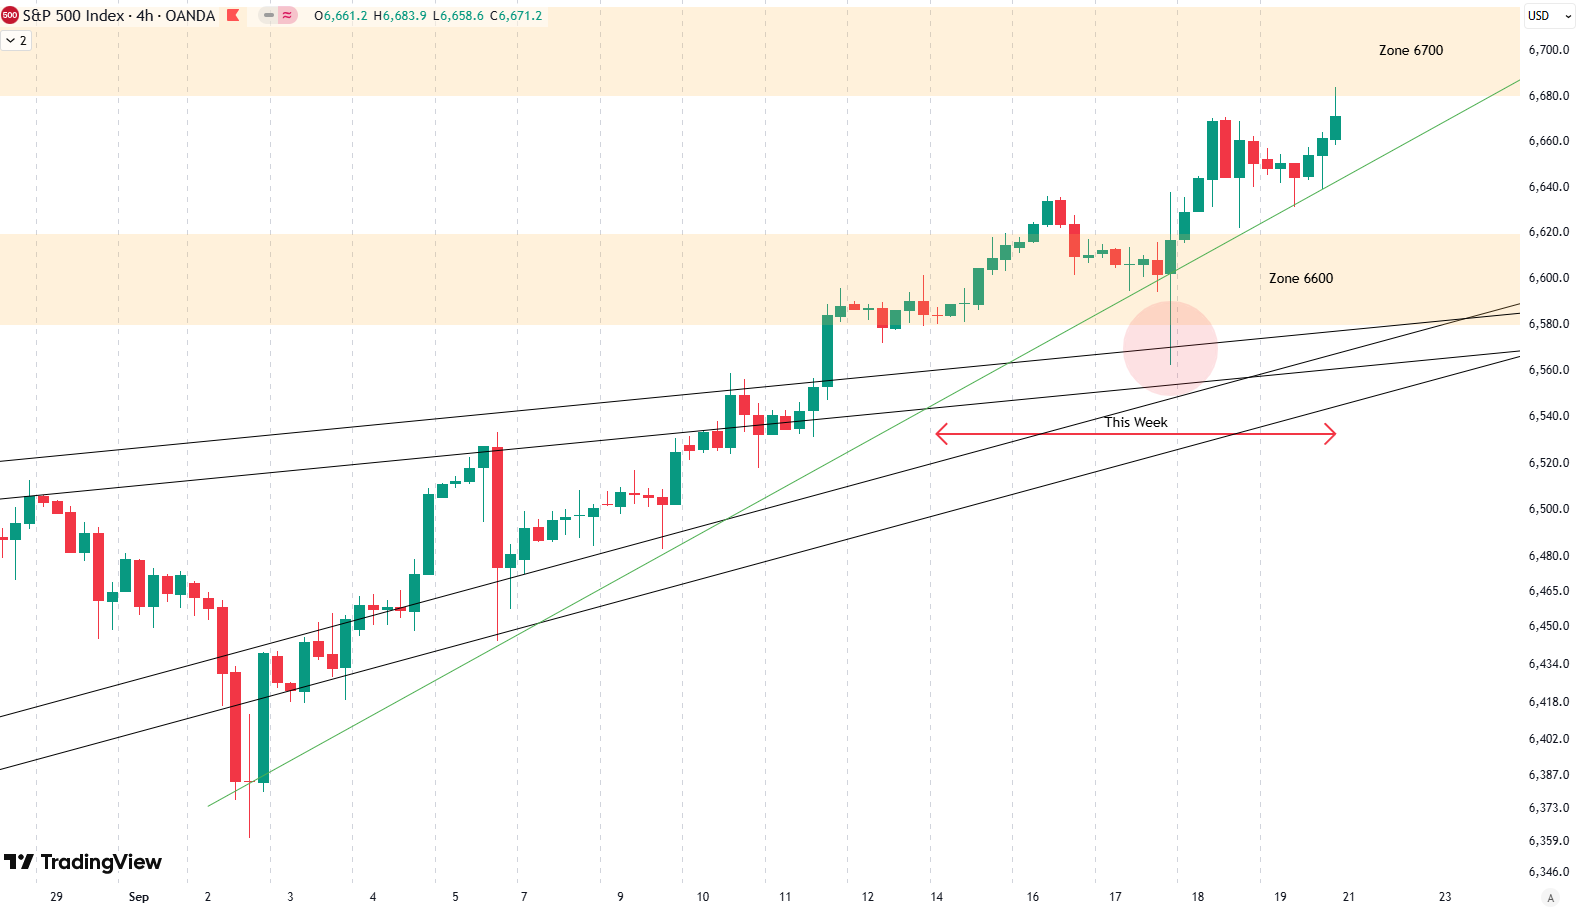
Weekly Update S&P 500
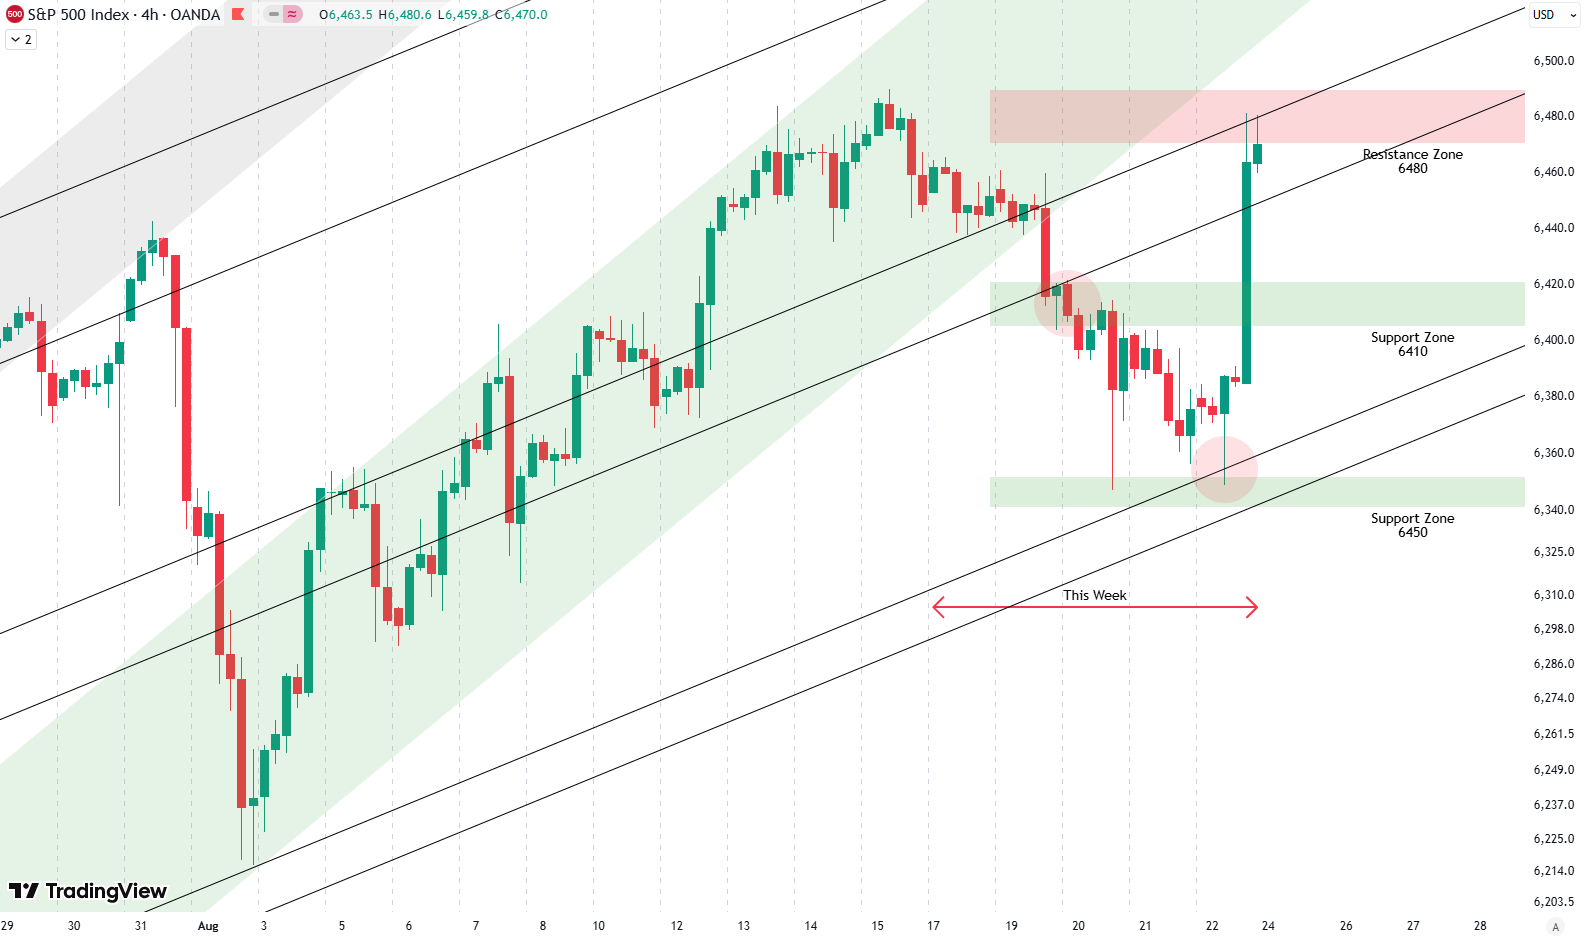
Hello everybody, so we had quite a strong week. The S&P 500 gained around 1.3% for the week. On the 4-hour chart, you can see the black trend lines marking the wedge formation we discussed last week. We broke out of that wedge, and on Wednesday we had a nice retest of the formation from…
-
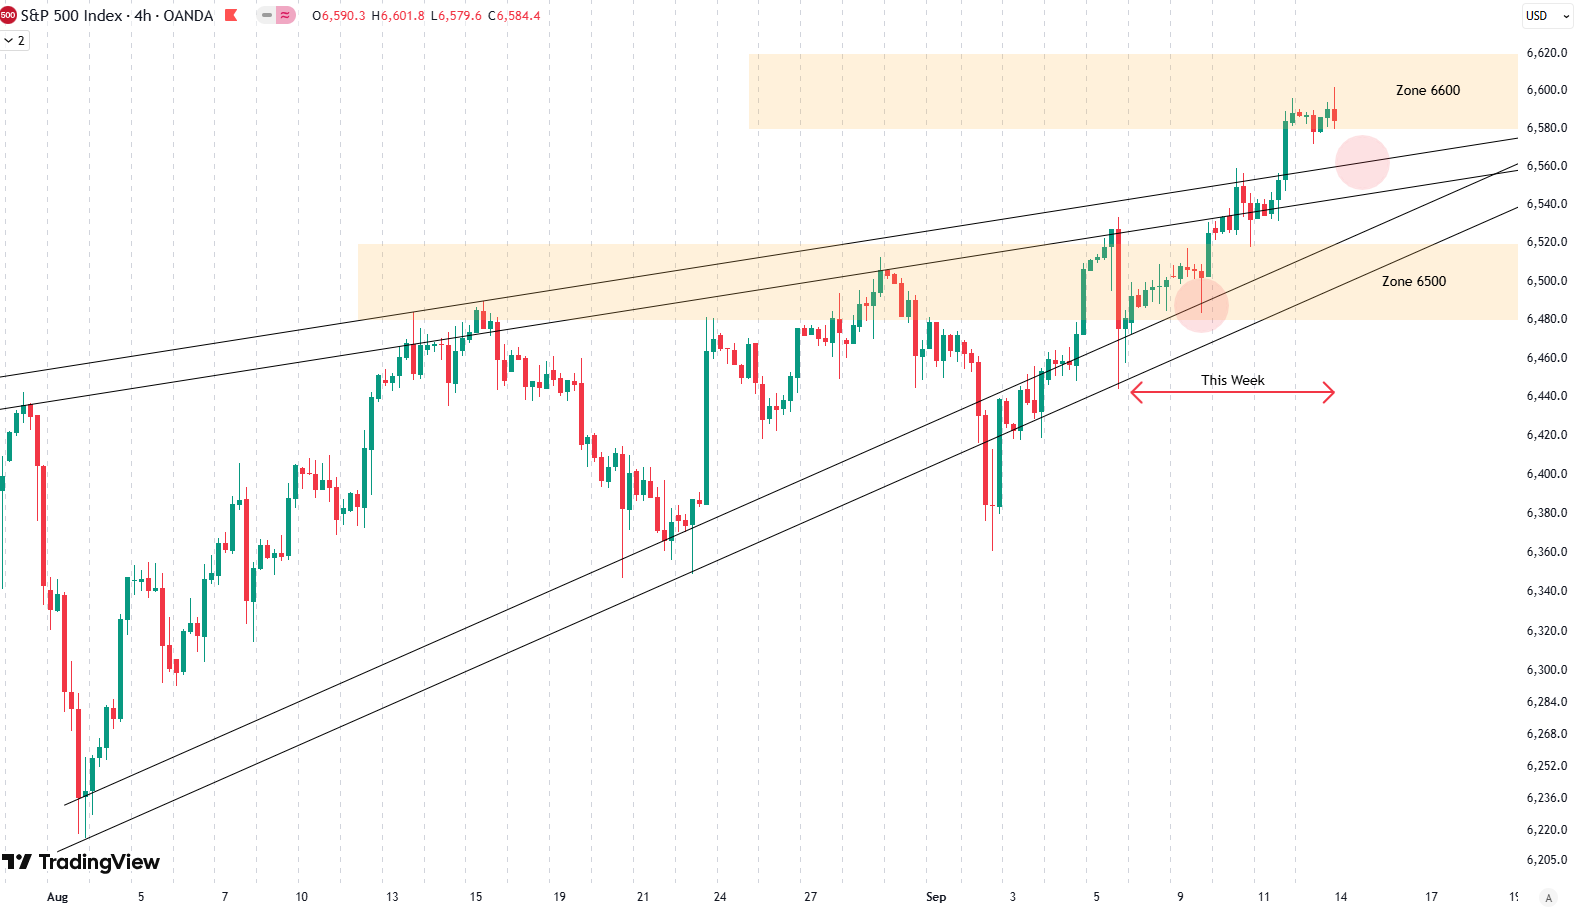
Weekly Update S&P 500
Hello everybody, and welcome to this week’s analysis of the S&P 500. This week was another very interesting one, with the index gaining about 1.6%. That’s quite a strong week, driven mainly by weak inflation data and soft job numbers from the US. These fueled expectations of a Fed rate cut next week, which the…
-
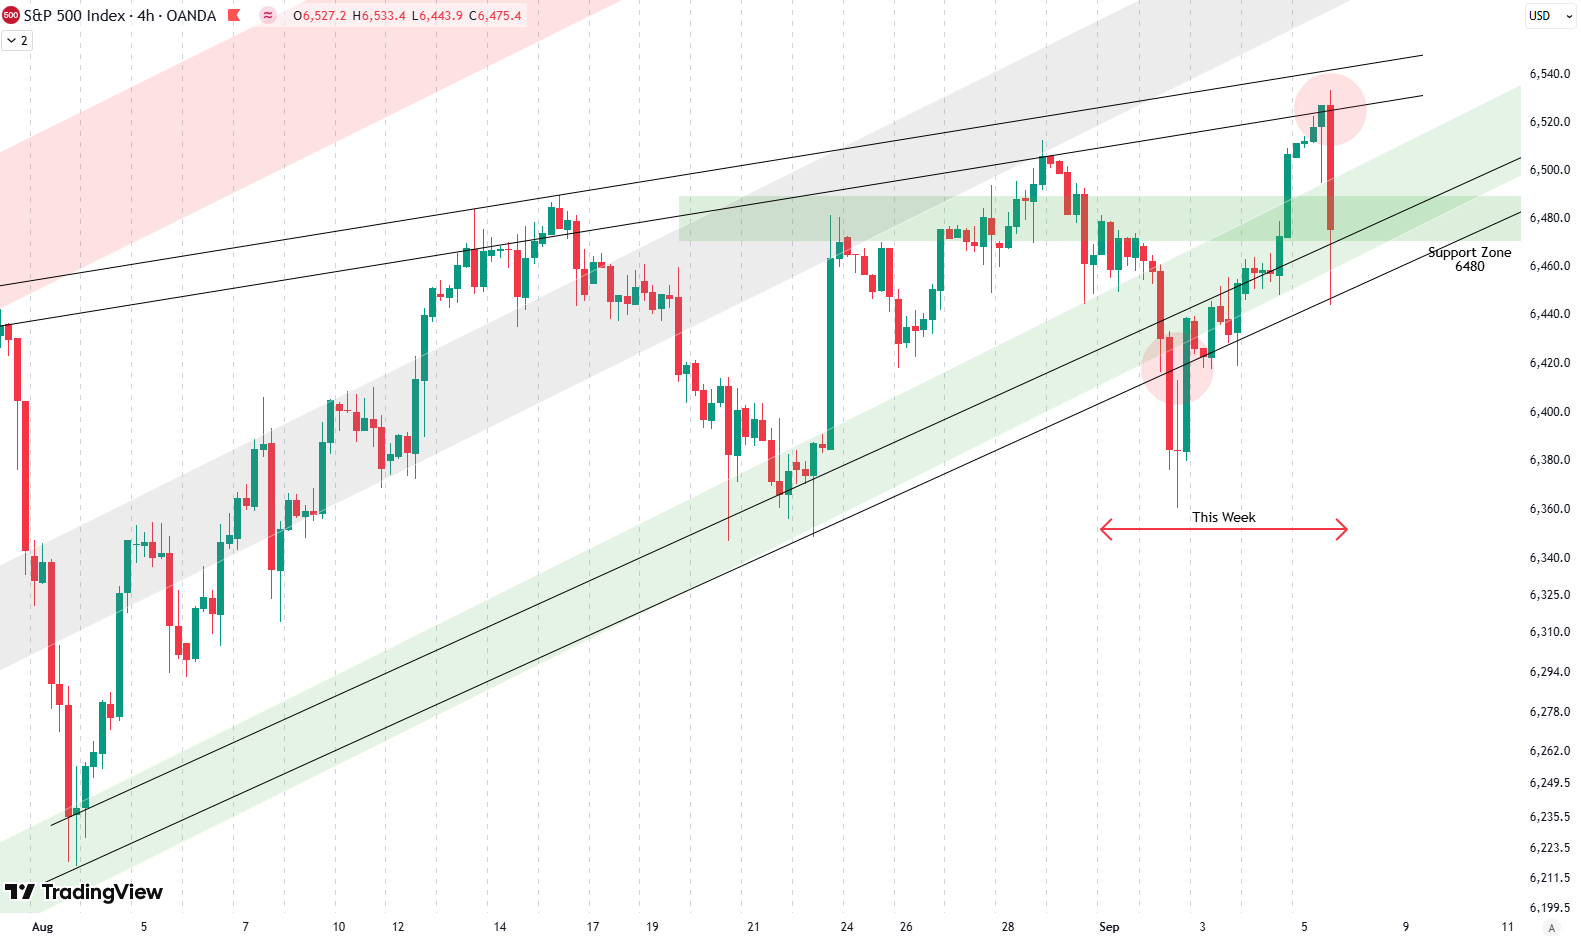
Weekly Update S&P 500
Hello everybody, so this week we’ve seen quite a bit of volatility. I’m writing this about two hours after the New York open. On the 4-hour chart, you can see a significant price drop on Tuesday. We had been following this rising wedge formation, marked by the black trendlines on the 4-hour chart, and on…
-
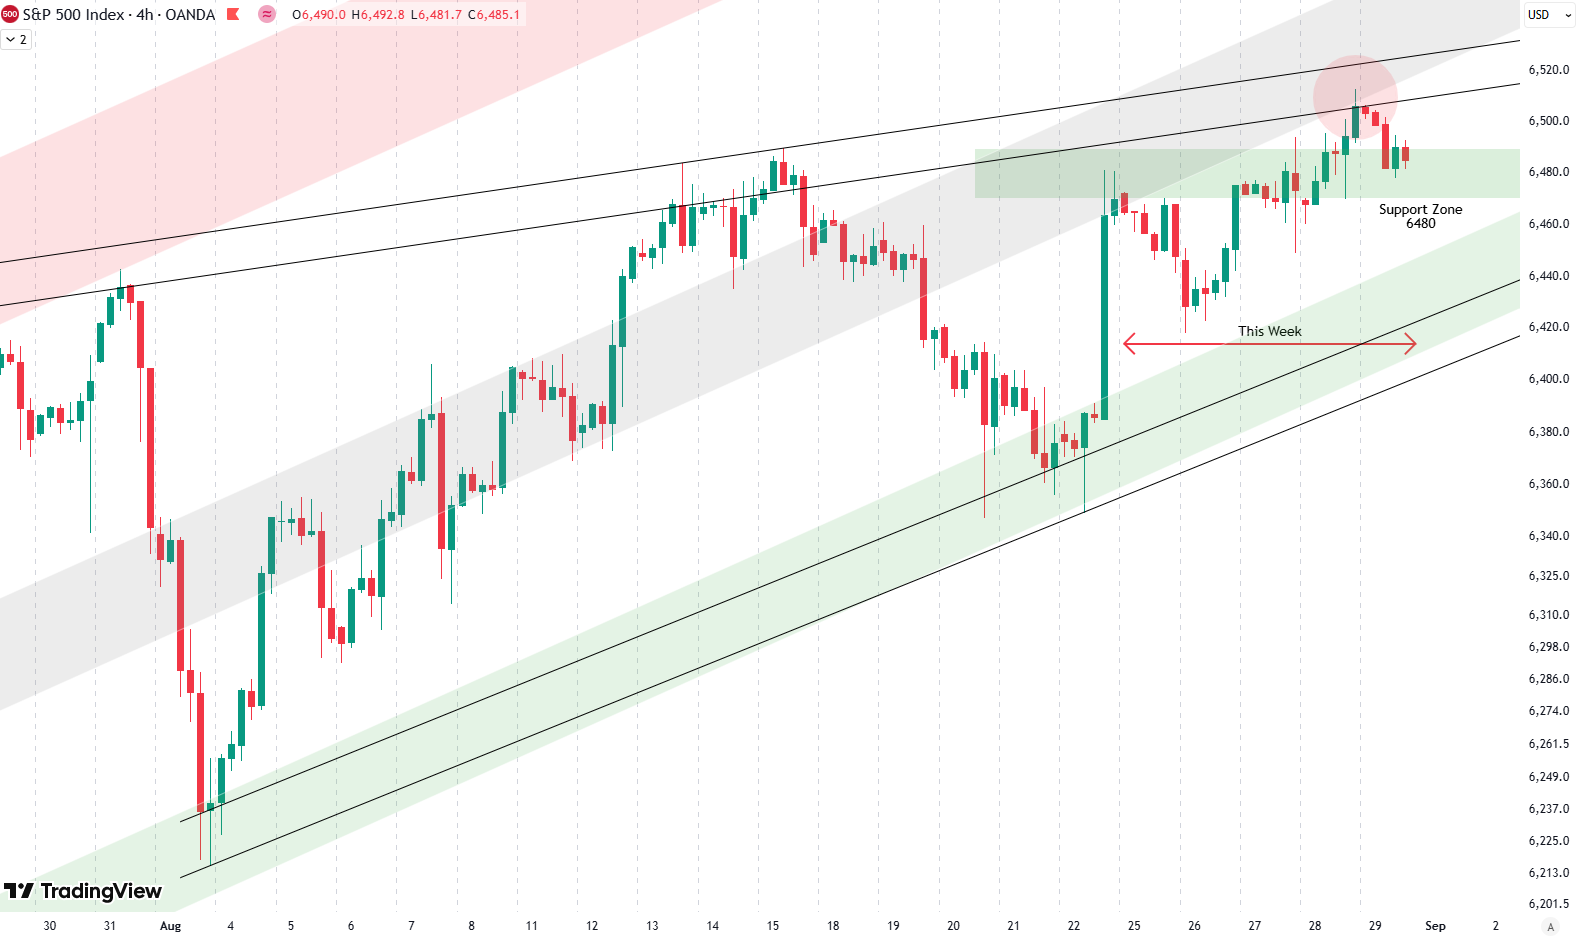
Weekly Update S&P 500
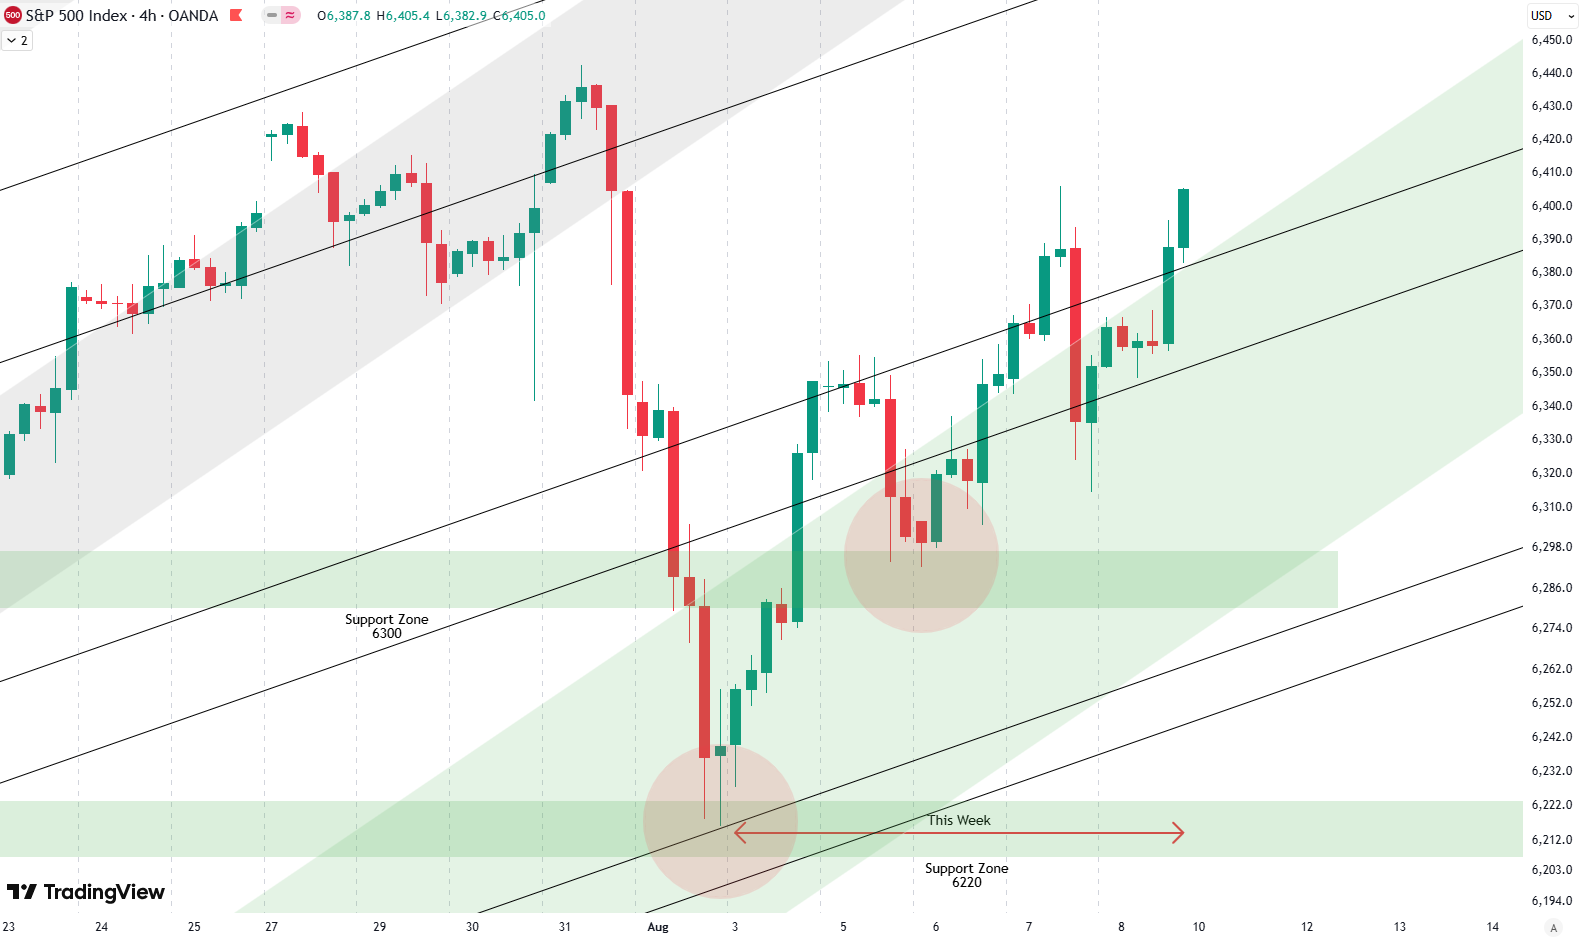
Hello everybody, welcome to this week’s analysis of the S&P 500. I’m writing this shortly before the New York open, and we are looking here at the 4-hour chart. So far this week, the S&P 500 has gained around 0.3%. Looking at the 4-hour chart, you can see this week’s price action. After the very…
-
Weekly Update S&P 500
Hello everybody, welcome to this week’s analysis of the S&P 500. This week, the S&P 500 gained 0.3%, with a lot of volatility in between. Looking at the 4-hour chart, we can see that at the beginning of the week, Monday and Tuesday, the S&P 500 moved sideways. We mentioned last week that we should…
-
Weekly Update S&P 500
Hello everybody, and welcome to this week’s analysis of the S&P 500. I’m writing this shortly before the New York market opens on Friday, so we don’t yet have the full day’s action included. For now, the S&P 500 is up about 1% this week, and we’ve had some interesting news. On one hand, we…
-
Weekly Update S&P 500
Hello and welcome to this week’s analysis on the S&P 500. The S&P 500 had a very strong gain of 2.6% this week. Looking at the four-hour chart, we can see that last week there was a very big and sharp drop, and the market basically closed the week at the lows of that decline.…
-
Weekly Update S&P 500
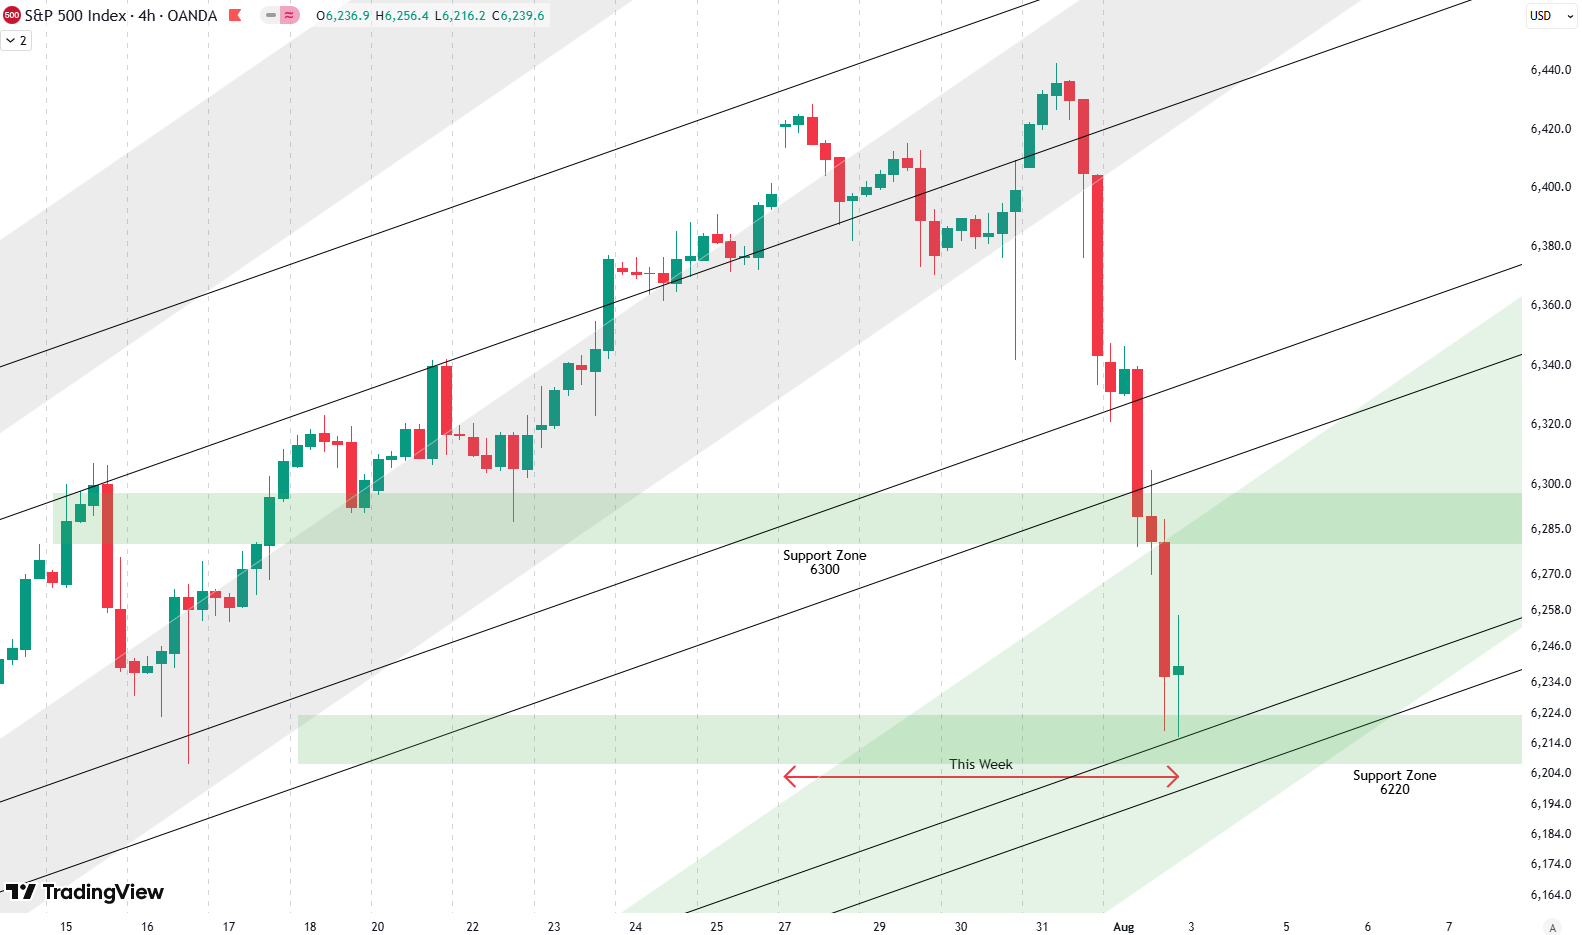
Hello everybody, and welcome to this week’s analysis on the S&P 500. This week, the S&P 500 had a loss of 2,5%. Last week, we talked about how the market was very overbought, and we looked at several downside levels — multiple support zones all the way down to the 6,000-point mark. It appears that…
-
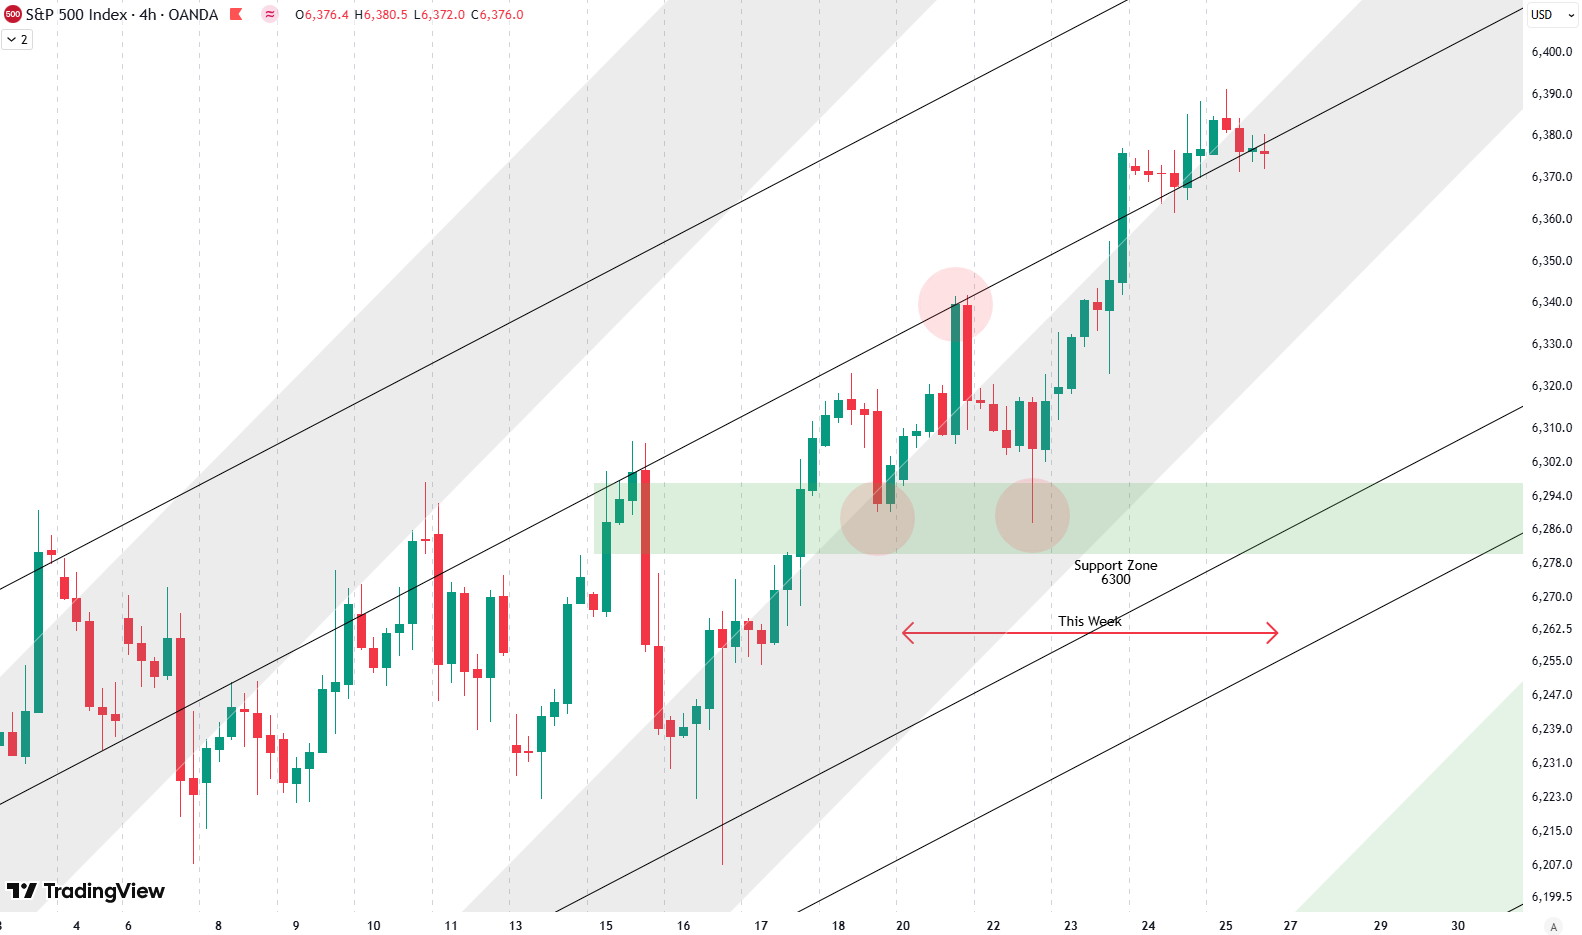
Weekly Update S&P 500
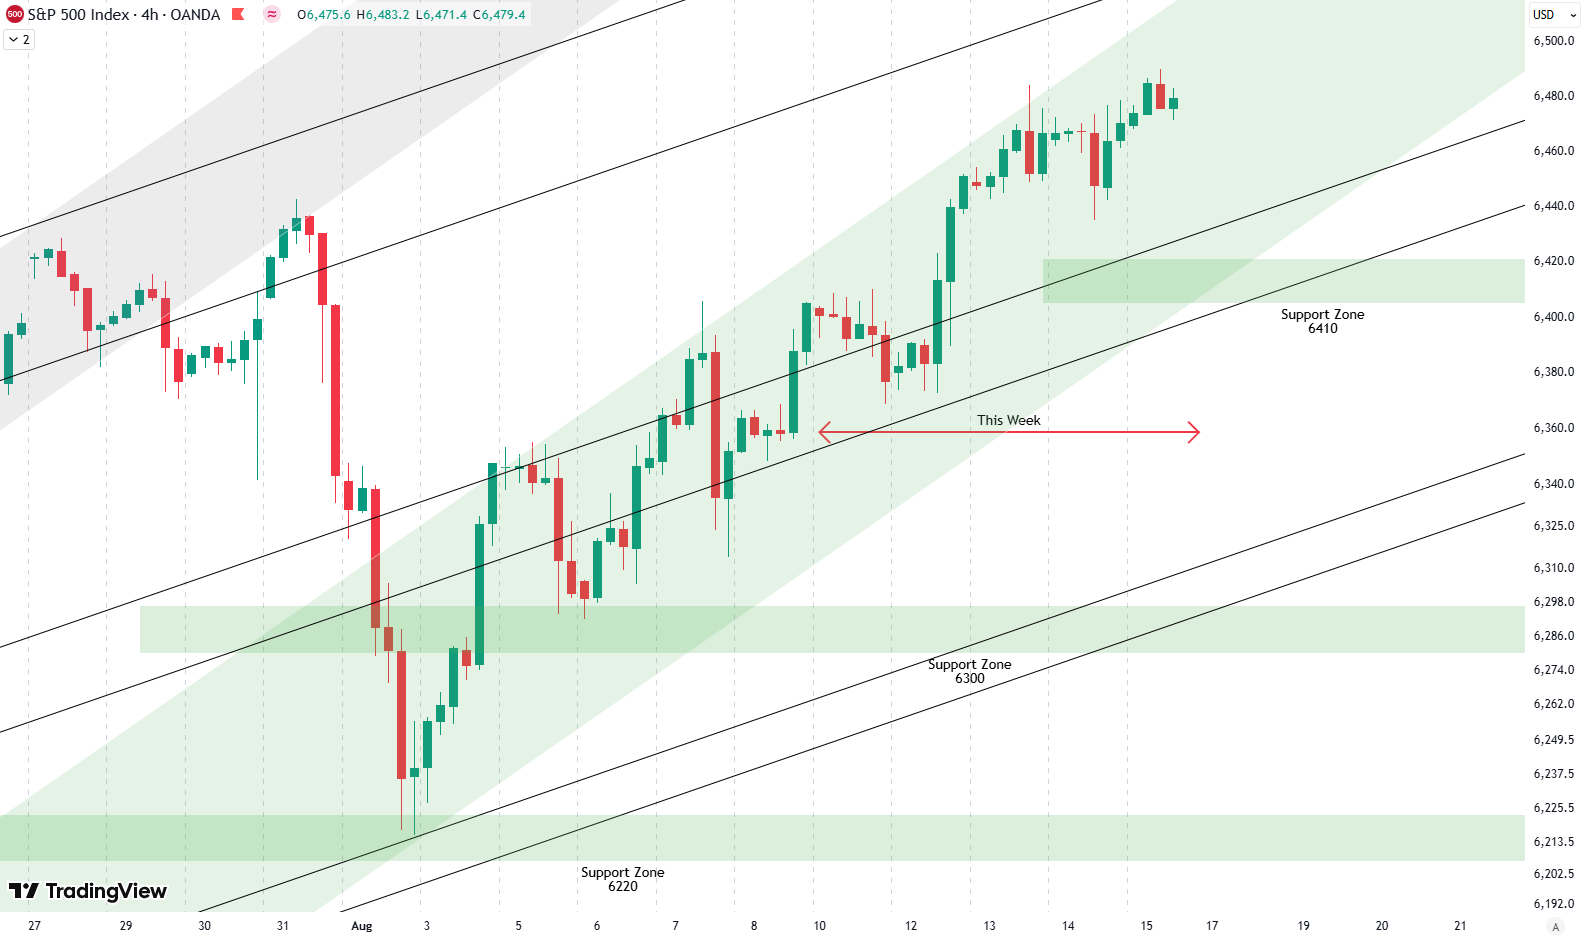
Hello everybody, and welcome to this week’s analysis on the S&P 500. I’m writing this shortly after the New York open on Friday, so far the S&P 500 gained 1,2% this week. We’re looking here at the 4-hour chart. Last week, we discussed the support zone around 6,300 points, which was tested during the late…
-

Weekly Update S&P 500
Welcome to our analysis of this week’s price action on the S&P 500. We begin by looking at the 4-hour chart, where we see the black trend channel that has been in place for a couple of weeks now — as discussed in several of our recent updates. Over the past few weeks, we’ve seen…